

The Illusion of Low Risk: Why Open-Ended Real Estate Funds Are Facing a Liquidity Storm
History doesn't always repeat itself, but often rhymes. Once again, headlines are buzzing with liquidity issues plaguing open-ended real estate funds. For seasoned market observers, the current situation feels uncomfortably similar to the dark days of the 2008 Financial Crisis.
As highlighted by recent media coverage, open-ended real estate funds are back in the spotlight for all the wrong reasons. Additionally, the latest comprehensive Scope Market Study (https://saprodscopeexplorer01.blob.core.windows.net/public/reports-links/Scope_Offene_Immobilienfonds_Gesamtmarktstudie_2026.pdf) maps out the mounting structural pressures across the sector.
This leaves everyday investors with a glaring paradox. If you look at the fundamental marketing and regulatory documents for these vehicles, one will frequently find a Summary Risk Indicator (SRI) of 2 out of 7 classifying them as "low risk".
How can a product labeled as low-risk suddenly face fund suspensions and freeze redemptions when market headwinds pick up?
The Structural Trap: Illiquid Assets vs. Liquid Liabilities
To understand why open-ended funds are inherently fragile, we have to look at their basic structural mismatch: asset-liability asymmetry.
An open-ended real estate fund owns either brick-and-mortar buildings or stakes in asset holding companies. These assets are less liquid. Investing in or exiting them often takes several months, if not longer. On the other side of the balance sheet, the fund's equity capital is theoretically liquid: investors expect to be able to withdraw their money on relatively short notice. This creates a critical funding mismatch that breaks down during market downturns.
A recent study on equity flows in open-ended real estate funds conducted by the IREBS Institute for Real Estate and Investment highlights two additional critical phenomena that aggravate this structural trap (see also: https://epub.uni-regensburg.de/78310/1/Heft%2032.pdf):
- Correlated Outflows ("The Run for the Door"): Under normal market conditions, investors inflows and outflows are independent, random events that balance each other out. However, when bad news hit the market, herd behavior takes over. Otherwise independent actions suddenly become heavily correlated. When the "run for the door" gains momentum, capital flees simultaneously, devastating the fund's cash reserves with all the consequences we faced during the Financial Crisis and are experiencing again today.
- The Institutional Advantage: Institutional investors move significantly faster than retail investors in both directions. According to the study, institutional investors are quicker to build up their investments, but they are also the first to head for the exits when things go south leaving retail investors to bear the brunt of the illiquidity.
The SRI Matrix: Math masking Reality?
How do funds maintain a low-risk profile despite such severe liquidity traps? We have to look at the regulatory mechanics of the Packaged Retail and Insurance-based Investment Products (PRIIPs) framework.
The SRI calculation consists of two primary components:
- Credit Risk: The risk of the management company defaulting (a minor risk here, as fund assets are legally segregated from the managing entity).
- Market Risk Measure (MRM): MRM is primarily measured by historical volatility to determine the final 1 to 7 SRI score.
For open-ended real estate funds, market risk is measured via Value-at-Risk (VaR) at a 97.5% confidence level over the fund's Recommended Holding Period (RHP). The VaR is then converted back into an annualized volatility metric called VaR-Equivalent Volatility (VEV) to secure the risk classification.
The basis for the VaR calculation is the Cornish-Fisher Expansion:
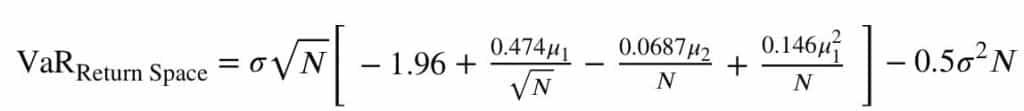
with:
VaR ... Value at Risk based on log-differences
N ... number of periods
σ ... standard deviation (2nd moment)
µ1 ... skewness (3rd moment)
µ2 ... excess kurtosis (4th moment)
Reiterating into VEV via:
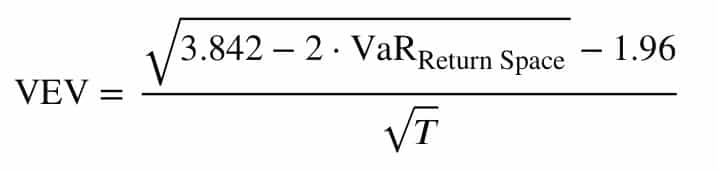
with:
T ... Recommended Holding Period
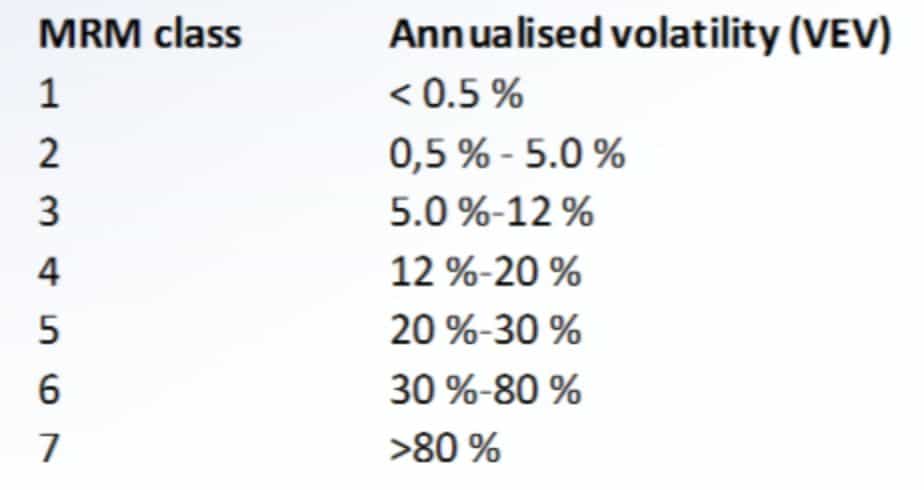
This dictates the risk classification according to PRIIPs (MRM classes):
The Illusion of Low Risk: Volatility
The MRM risk classification is based on a fund's Net Asset Value (NAV) development. The primary driver of NAV is the yield development of the underlying asset class.
Herein lies the flaw: In general, the update of property yields happens once a quarter, while the NAV (for retail funds) is published daily. Under ordinary market conditions, the daily NAV barely moves, giving the illusion of incredibly low volatility. The PRIIPs formula eats this data and spits out a "low risk" profile.
But let's approximate this risk classification system using the actual basic yield development of an asset class. Here is an example of an investment yield development over the last 20+ years:
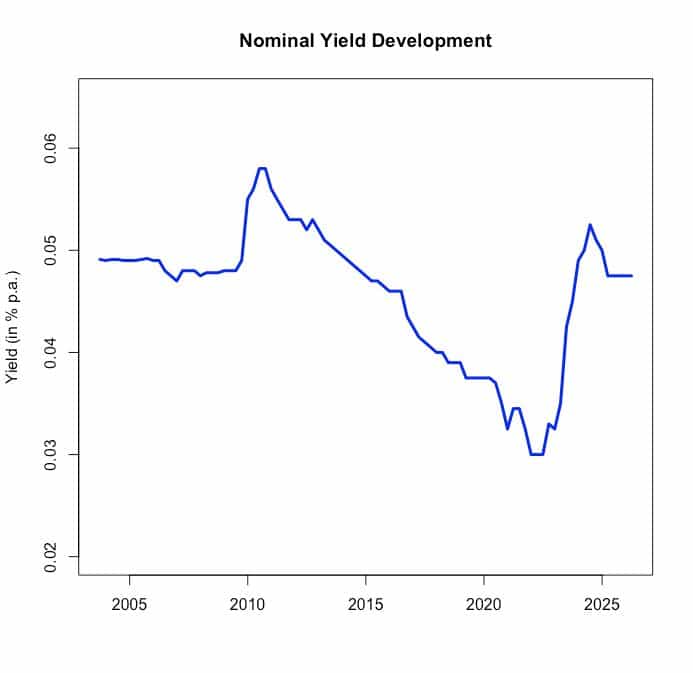
Notice that there are long periods of low variability interrupted by sharp, distinct yield changes.
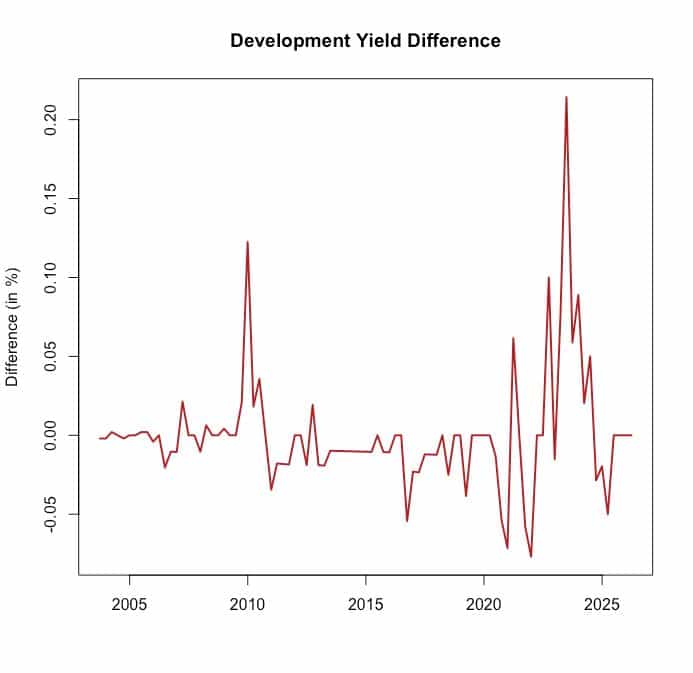
Because the true frequency of yield shifts is quarterly, not daily, the number of periods (N) in the formula above gets much smaller.
When we calculate the VaR-Equivalent Volatility for this actual investment yield, it equals 8.1% p.a. for a 5-year holding period. This immediately bumps the real-world risk into Class 3 (moderate-low), degrading the "low risk" label.
To put it into perspective: With a VaR at a 97.5% confidence level, there is a 2.5% chance that the loss of the invested equity capital is more than 31%. Here, some details:
- VaR(at 97.5%) = -0.3706 on logarithmic scale
- Asset Value (at 97.5%) = exp(-0.3706) = 0.6903,
i.e. appr. 69 % remaining asset value and
an expected overall loss over the holding period of more than 31%
with a 2.5% probability.
An expected overall loss of more than 31% over the holding period with a 2.5% probability doesn't sound like a "low risk" safe haven anymore.
The Illusion of Low Risk - Trend
Another critical factor is that in general commercial investment yields tend to follow trends. While experiencing a period of low variability, the investment yield might follow an upward trend, leading to a sustainable deterioration in market values.
To understand the consequences of those trend lines, we incorporated the empirc behavior of our example yield into a Markov-Switching Regime Change Model and ran a Monte Carlo simulation over a 5-year period. Again, the results are sobering:
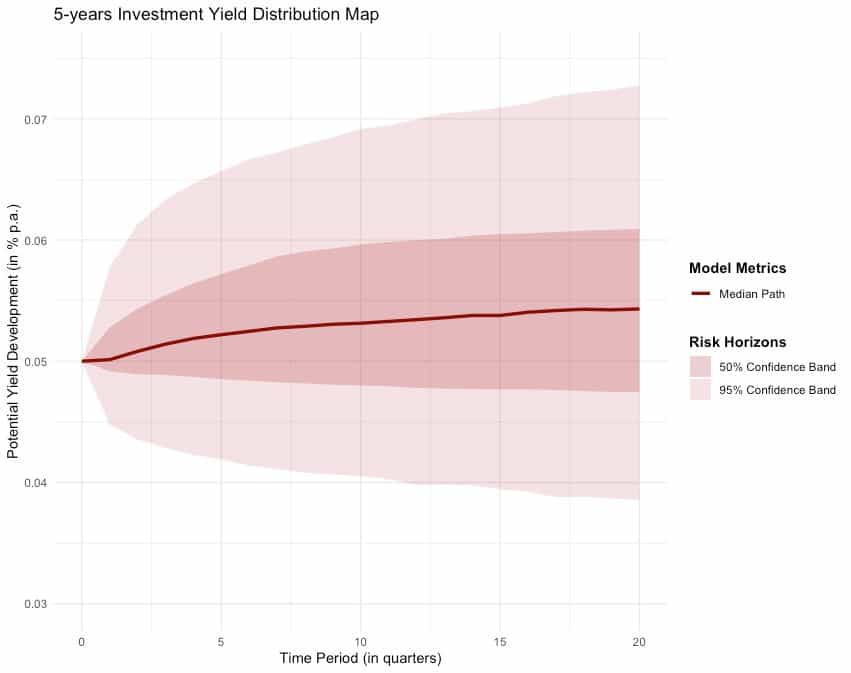
When entering an investment position during the wrong trend line, the risk of making a loss is close to 60% while Value at Risk (at 97.5%) amounts to -6.4% p.a. So, there is a 2.5% chance to make an overall loss of more than 32% during this investment period.
Even when yield developments are simulated under more favorable conditions, the Value at Risk at 97.5% confidence interval still holds at a significant 5.7% p.a.
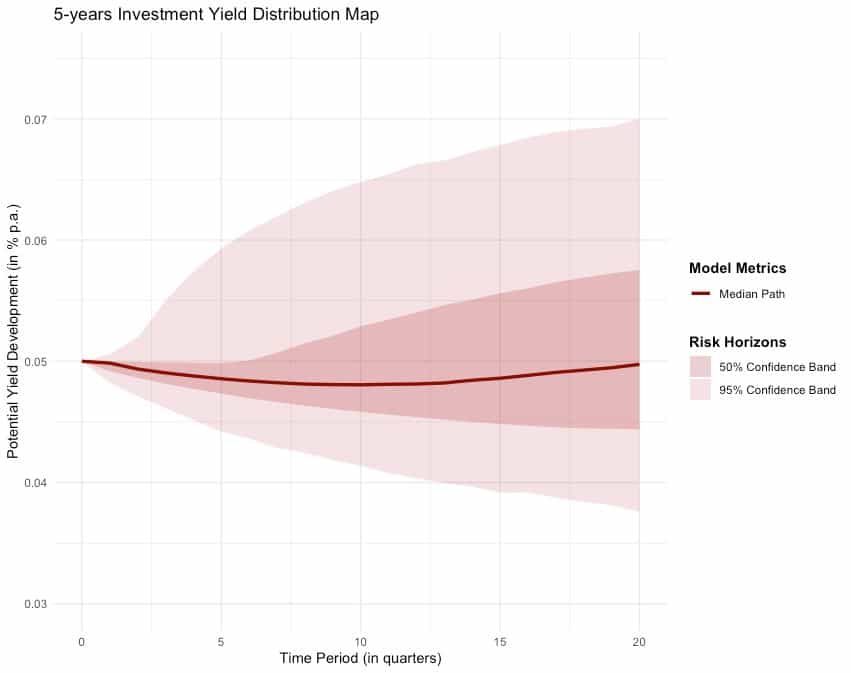
From this perspective as well, we are far from safety of a "moderate-low" risk profile.
Conclusion: Beyond the Label
The structural and mathematical blind spots of open-ended real estate funds are no longer just a topic for quantitative analysts. They have officially entered the courtroom.
In a landmark ruling, the Regional Court (Landgericht) of Nürnberg-Fürth (Az. 4 HK O 5879/24) ruled that a major asset manager could no longer market its open-ended real estate fund under the low-risk banner of an SRI 2 or 3. The court went as far as to label the low-risk classification a "Sicherheitsillusion" (illusion of safety), stating that given the true frequency of underlying property asset valuations, a Risk Class 6 - putting it on par with volatile equity funds - is legally justified. While the case has since been escalated to the European Court of Justice for a final systemic interpretation, the signal to the market is defeaning.
The current regulatory framework creates a dangerous blind spot. By relying on smoothed daily NAV data that masks the illiquid reality of real estate assets, the PRIIPs 1-to-7 scale provides a false sense of security.
An SRI of 2 out of 7 might satisfy historic compliance models, but it does not grant immunity from macroeconomic gravity. When yields shift and institutional capital heads for the door, the structural mismatch of open-ended funds is ruthlessly exposed, leaving retail investors trapped in frozen vehicles.
Efficient risk management isn't found in a smoothed regulatory formula. It is found in understanding market reality. For asset managers, distributors, and investors alike, the message is clear: It's time to stop selling illiquidity wrapped in the illusion of low risk.