
Close

Across the open-ended real estate fund segment, one word returns in almost every conversation: the trust. It appears wherever the current equity strain is discussed, and its restoration is often described as the way out of the capital drain.
The instinct behind that word is understandable and it can be something a fund earns through its own conduct given the often mentioned disadvantage of its business model, which rests on a known structural tension: long-term, illiquid assets are funded by capital that can be withdrawn at short notice. Given that tension, and given recent events across the segment, the clearest signal of trustworthiness would have to come from the funds themselves. One very obvious and visible way would be shown in the picture on how faithfully their numbers track the market around them.
On that measure, the current situation invites some questions. Across the segment, published valuations reflect present conditions only partially. In certain cases the gap is wider than partial. The reported value does not simply lag the market; over recent years it has continued to rise while the market has moved the other way.
This piece tests that claim against a single fund of a common profile: first against the market around it, then against its own structure.
1. The divergence
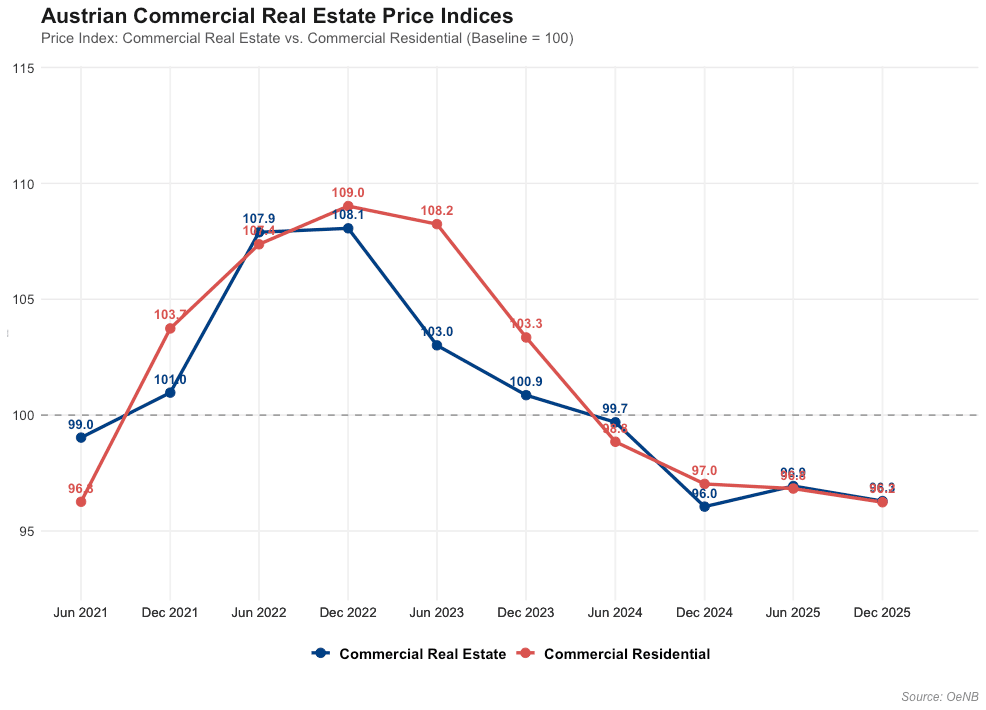
Reading a fund against the market first requires a measure of the market that no single fund controls. The OeNB Commercial Real Estate Price Index serves that purpose. It covers the period from June 2021 to December 2025, and it shows a clear decline from the middle of 2022, coinciding with the start of the ECB rate-tightening cycle. Both the commercial real estate and the commercial residential series fall from a peak near 108 to 109 at the end of 2022 to roughly 96 by the end of 2025. Depending on the asset class, the reduction from the mid-2022 peak runs between roughly 9 and 14 percent. Germany shows a broadly comparable pattern over the same period.
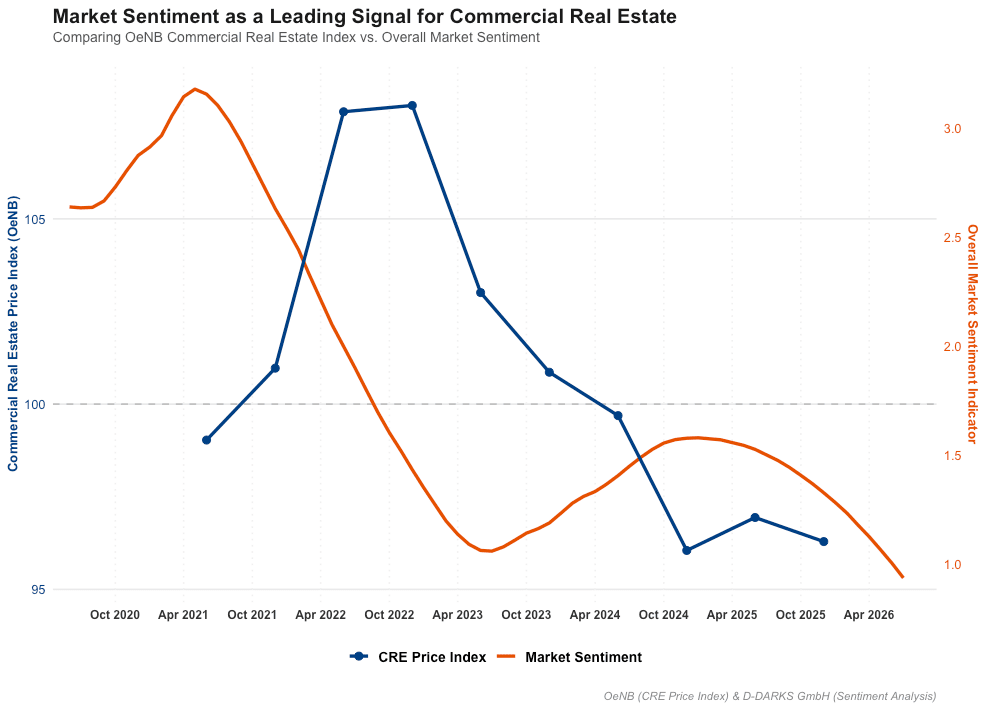
At this point, the official index only covers the period till December 2025. To fill the gap to the present, mid-2026, and to see where prices are heading next, we turn to the D-DARKS Market Sentiment Index, which gives no sign of improvement through the remainder of 2026. Measured consistently from institutional and market communication, sentiment has anticipated the turns in the price index before, at the peak and again at the low. Right now it is falling again, which suggests prices will weaken further rather than recover in 2026.
Set against that backdrop, consider a fund of a common profile. It carries a daily NAV quotation and holds commercial real estate in Germany and Austria. Close to half of the portfolio consists of office assets, with another 15 percent in commercial residential assets. In composition, the fund comes close to what the OeNB index represents. Its NAV, driven mainly by the appraisal-based valuation of the underlying assets, nevertheless shows uninterrupted appreciation across the same period, and across the two decades before it.
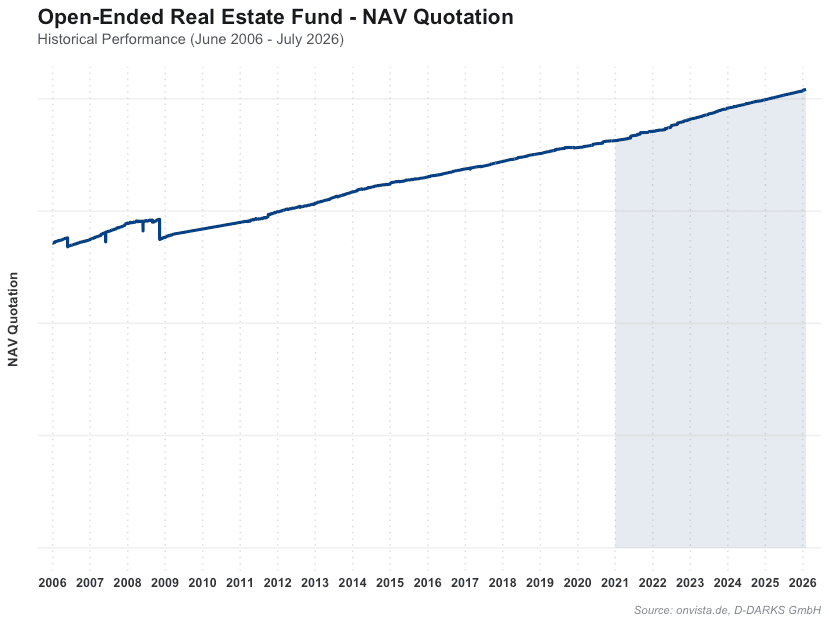
So here, two independent readings of the market point down, and the fund points up. The question worth asking is a plain one. What mechanism allows an appraisal-based NAV to remain insulated from a market its own portfolio closely tracks?
2. The portfolio and the timing
Part of the answer rests in the timing of acquisition. A fund of this profile typically follows a pro-cyclical strategy. When setting the timing of the portfolio purchase against prime office yields in Vienna and Frankfurt, the concentration becomes clear. The bulk of the portfolio was acquired roughly between 2016 and 2021, when prime yields stood well below current levels. Around 80 percent was bought into that low-yield window. Prime yields have since risen back toward, and past, their levels of a decade earlier.
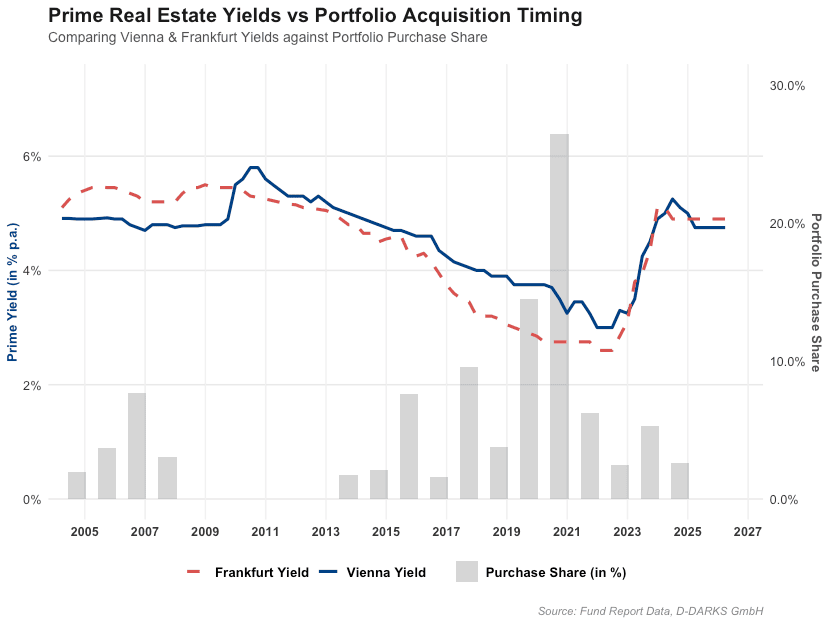
Cyclical behaviour tends to have consequences in both directions. Inflation lifts rents and, in turn, supports valuations, yet that support does not offset the heavy yield shift of the past two to three years. The fund’s reporting bears this out in a particular way. Devaluations and revaluations across the portfolio net out to a negligible overall effect, while the NAV continues its slow and steady rise. The result is a number that stays calm while the market underneath it moves.
3. The liquidity mechanism
Operationally, a portfolio of this kind can look sound. Occupancy near 95 percent meets the benchmark of peer funds. Operating cash flow remains positive, though in the first half of 2026 gets noticeably reduced by maintenance costs. The strain, therefore, does not originate in operations, but on the liability side of the fund.
The Cash Flows below are shown as representative of that profile. They make the underlying pattern legible:
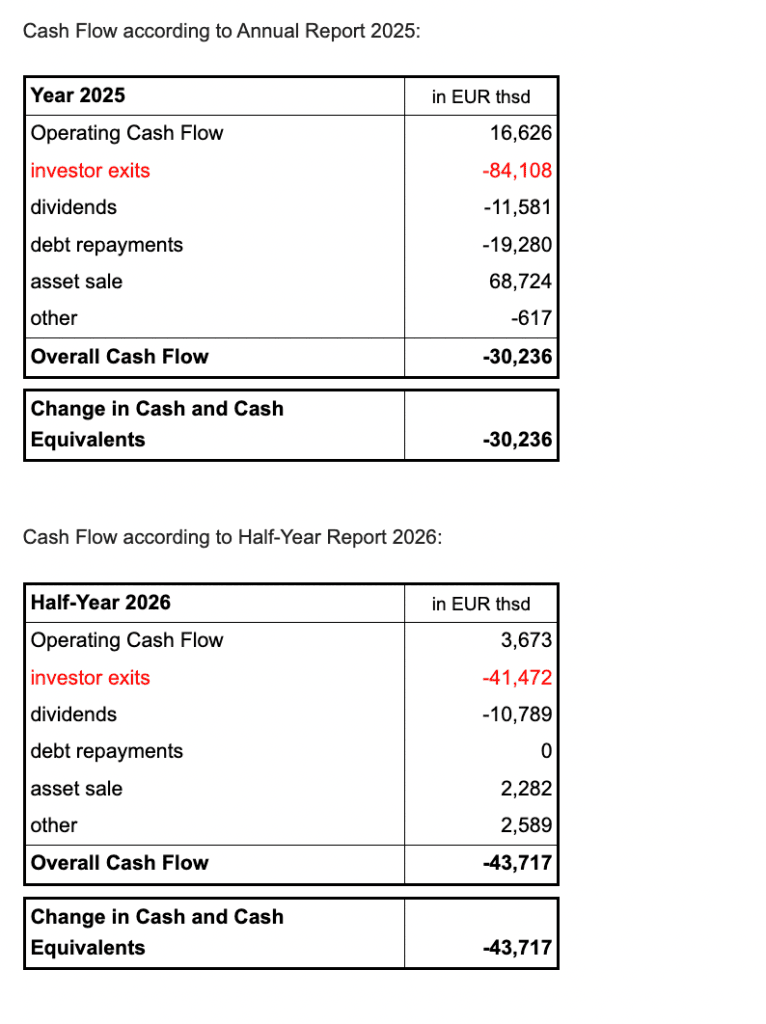
Two figures carry this section. Over eighteen months, net investor exits reach roughly EUR 125 million. Together with dividends and debt service, the fund draws down more than 40 percent of its cash and cash-equivalent position during this short period. The six-month drain in the first half of 2026 already exceeds the full-year drain of 2025.
The asset side does not keep pace with that demand. Sale proceeds in 2025 already lagged behind cash requirements. In the first half of 2026 no major sale was completed. Two disposals were announced without published prices, and the associated debt repayments still fall due within the year. The 2025 sales realised a slight loss, modest in isolation, though less so read as a leading indicator under continued pressure.
This is the structural point, and it belongs to no single manager. Long-term, illiquid assets are funded by equity that can be redeemed at short notice. While the rating framework stays benign, that mismatch remains invisible. When it turns, redemptions convert an appraisal-stable NAV into a liquidity problem, and disposals into forced disposals.
4. What the structure produces
A NAV that rises through a falling market does not remove the risk, but it relocates it, from the price itself to the moment the price finally moves. That is the illusion of safety expressed in a single line: the number looks calmest precisely where the exposure is building.
For a fund of this profile, the consequences fall on the remaining investors rather than the departing ones. Leaving investors are paid out at a NAV that has not yet reflected the market. Should redemption pressure persist and disposals continue to lag, the fund may need to reach out for liquidity measures. Remaining investors would then face the risk of abrupt NAV corrections, delayed access to their capital, or both together. Upcoming changes to the investment fund law framework, effective from the beginning of 2027 (read more about it here) are widely expected to add to redemption pressure in the short run rather than relieve it.
Here the structure meets its own limit. Valuation of this kind is event-based and, by design, backward-looking. It records the strain only after the fact. The market's own signals move well earlier, as Section 1 showed with the sentiment reading. They appear ahead of the appraisal that eventually confirms them. That interval, between what the market already indicates and what the NAV has yet to record, is the whole difference between managing an exposure and being overtaken by one.
Only days ago, the news hit the German financial market like a thunderclap: KanAm’s open-ended real estate fund Leading Cities Invest is being wound down. Burdened by an uncontrollable strain of capital outflows and a deteriorating real estate environment, the fund has thrown in the towel.
For years, open-ended real estate funds were sold as the bedrock of conservative portfolios - boring, steady, and safe. But as the KanAm collapse demonstrates, these vehicles are a textbook example of what Nassim Nicholas Taleb describes in his Statistical Consequences of Fat Tails. They embody a dangerous structural illusion: low risk most of the time, punctuated by sudden, catastrophic, power-law-driven collapses.
To put it bluntly: Nothing happens, until it does.
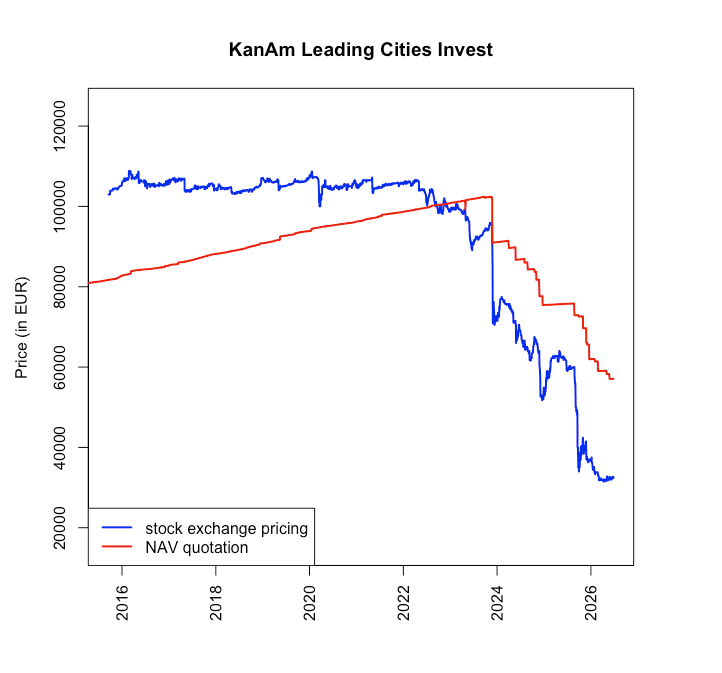
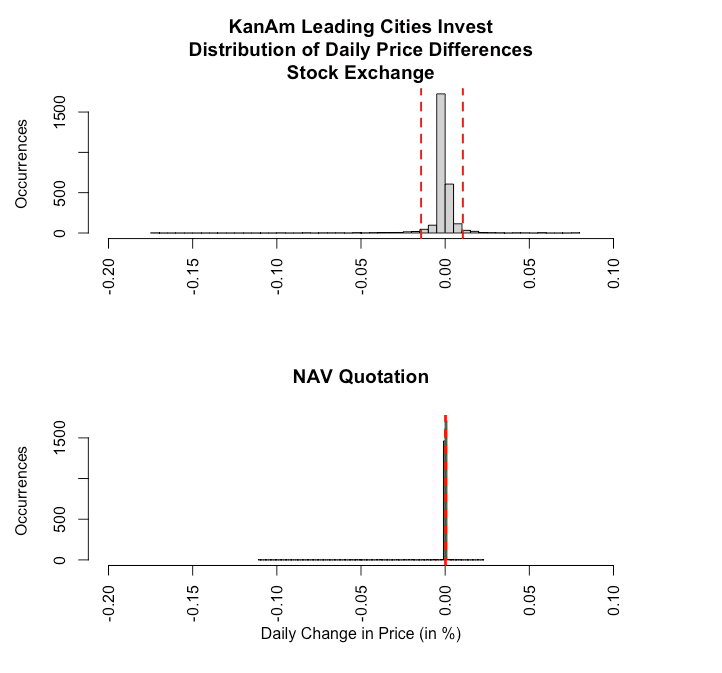
When you look at the daily price changes at KanAm over its lifetime, the overwhelming majority of days are completely uneventful.
KanAm Leading Cities Invest - a Tale of Two Markets:
If you look at the Distribution of Daily Price Differences, the “body” of the distribution tells a story of absolute tranquility. For both the stock exchange pricing and the NAV quotation, the daily changes cluster tightly around 0%.
As recent research by the IREBS (International Real Estate Business School) highlights, open-ended real estate funds suffer from a high structural dependency on capital exits. When a trigger occurs, such as a significant commercial real estate devaluation, the pattern easily breaks.
Once institutional and retail investors feel the threat, capital outflows accelerate. Because real estate is fundamentally less liquid, the fund cannot sell properties fast enough to meet redemption requirements without destroying value. This triggers a vicious cycle:
This is exactly what happened to KanAm in November 2023 (see graph above).
Moving from the peaceful “body” of the distribution to the “tail area”, it gets obvious, that Power Law - behavior takes over.
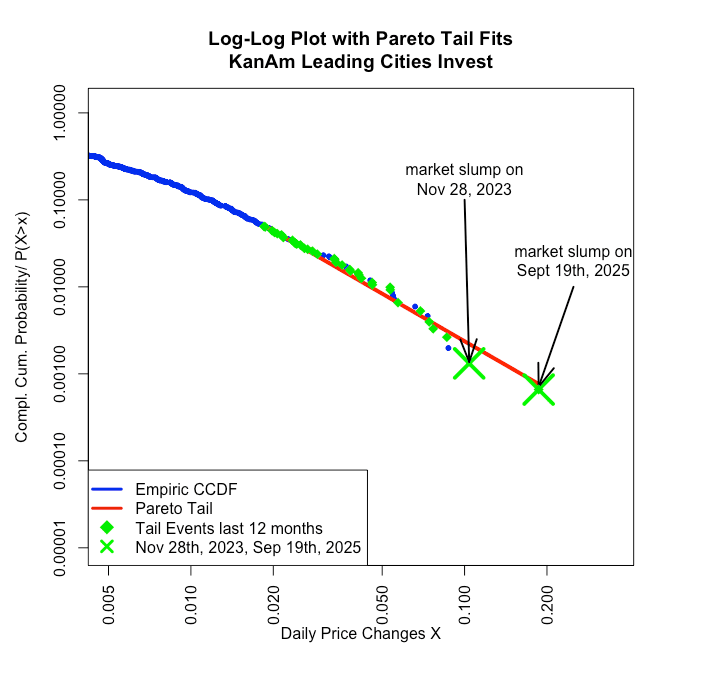
In the graph above, KanAm reveals a Pareto-tail with an alpha of 2.8. In the world of fat tails, an alpha this low indicates an incredibly fat tail. This means that extreme fluctuations are far more frequent and mathematically probable than the standard risk classification would ever suggest.
Considering the last 5 years in stock exchange pricing, KanAm’s Volatility Estimation Valuation (VEV) reached a staggering 23%. According to PRIIPs methodologies, this level of VEV does not land you in the low-risk or moderate-low risk classes. Rather, it firmly places the fund into Risk Class 5, sharing a risk profile with volatile equity funds and high-yield credit instruments.
The massive market slumps on November 28, 2023 and September 19, 2025, were the systemic manifestation of this fat tail. They were the Black Swans that signaled the end was near.
Taking KanAm as some kind of blueprint for open-ended real estate funds’ tail behavior, we must immediately turn our attention to other giants in the market, like UniImmo Wohnen ZBI.
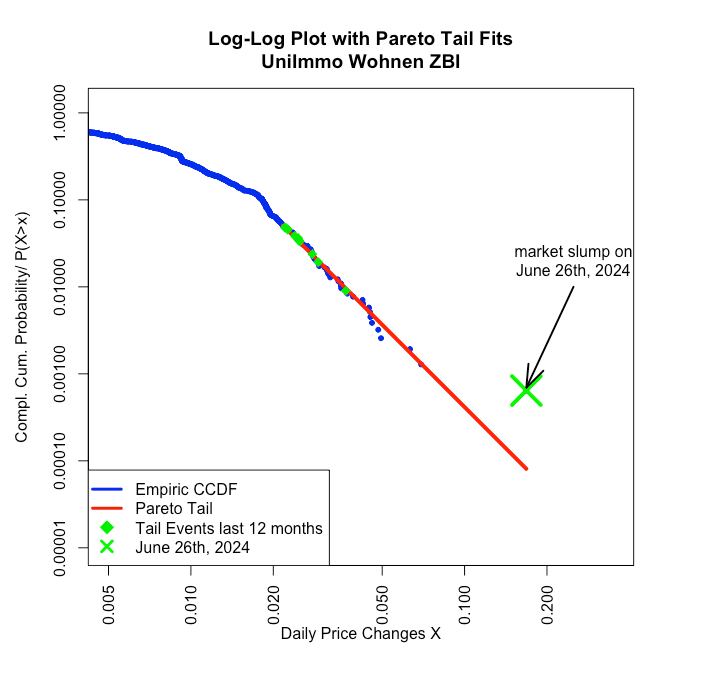
Again, a massive write-off in assets triggered a price slump in June 2024, indicating a Black Swan in the making. Though, the tail analysis suggests otherwise. The price slump in June 2024 was not a Black Swan but a Grey Swan. Something to be expected, as the price development enters its (fat) tail behavior.
As asset values continue to face pressure and the correlation of capital outflows increases across the industry, UniImmo is sitting on the exact same structural fault lines. The tail has already shown itself. In case the dependency of capital outflows tightens, a KanAm-style accelerating downward spiral has its potential and is not a distant mathematical impossibility.
The winding down of KanAm Leading Cities Invest is a stark reminder that in finance, absence of evidence is not evidence of absence. Just because a fund hasn’t blown up in ten years doesn’t mean it is safe. It just means the tail hasn’t been triggered yet.
For regulators, distributors, and investors alike, relying on smooth historical NAV lines is a recipe for ruin. It is time to stop treating open-ended real estate funds as stable deposit alternatives, and start respecting them for what they truly are: wild, fat-tailed animals capable of creating heavy losses when the pattern finally breaks.
Ultimately, the systemic vulnerability of open-ended funds to rapid capital flight means that backward-looking quantitative metrics are no longer enough. To survive, fund managers are advised to shift their focus from historical market data towards real-time insights driven by market sentiment analytics. This gives them a chance to anticipate upcoming market developments, adjust their risk positions and prepare for the most probable reactions of their stakeholders in due time.
History doesn't always repeat itself, but often rhymes. Once again, headlines are buzzing with liquidity issues plaguing open-ended real estate funds. For seasoned market observers, the current situation feels uncomfortably similar to the dark days of the 2008 Financial Crisis.
As highlighted by recent media coverage, open-ended real estate funds are back in the spotlight for all the wrong reasons. Additionally, the latest comprehensive Scope Market Study (https://saprodscopeexplorer01.blob.core.windows.net/public/reports-links/Scope_Offene_Immobilienfonds_Gesamtmarktstudie_2026.pdf) maps out the mounting structural pressures across the sector.
This leaves everyday investors with a glaring paradox. If you look at the fundamental marketing and regulatory documents for these vehicles, one will frequently find a Summary Risk Indicator (SRI) of 2 out of 7 classifying them as "low risk".
How can a product labeled as low-risk suddenly face fund suspensions and freeze redemptions when market headwinds pick up?
To understand why open-ended funds are inherently fragile, we have to look at their basic structural mismatch: asset-liability asymmetry.
An open-ended real estate fund owns either brick-and-mortar buildings or stakes in asset holding companies. These assets are less liquid. Investing in or exiting them often takes several months, if not longer. On the other side of the balance sheet, the fund's equity capital is theoretically liquid: investors expect to be able to withdraw their money on relatively short notice. This creates a critical funding mismatch that breaks down during market downturns.
A recent study on equity flows in open-ended real estate funds conducted by the IREBS Institute for Real Estate and Investment highlights two additional critical phenomena that aggravate this structural trap (see also: https://epub.uni-regensburg.de/78310/1/Heft%2032.pdf):
- Correlated Outflows ("The Run for the Door"): Under normal market conditions, investors inflows and outflows are independent, random events that balance each other out. However, when bad news hit the market, herd behavior takes over. Otherwise independent actions suddenly become heavily correlated. When the "run for the door" gains momentum, capital flees simultaneously, devastating the fund's cash reserves with all the consequences we faced during the Financial Crisis and are experiencing again today.
- The Institutional Advantage: Institutional investors move significantly faster than retail investors in both directions. According to the study, institutional investors are quicker to build up their investments, but they are also the first to head for the exits when things go south leaving retail investors to bear the brunt of the illiquidity.
How do funds maintain a low-risk profile despite such severe liquidity traps? We have to look at the regulatory mechanics of the Packaged Retail and Insurance-based Investment Products (PRIIPs) framework.
The SRI calculation consists of two primary components:
- Credit Risk: The risk of the management company defaulting (a minor risk here, as fund assets are legally segregated from the managing entity).
- Market Risk Measure (MRM): MRM is primarily measured by historical volatility to determine the final 1 to 7 SRI score.
For open-ended real estate funds, market risk is measured via Value-at-Risk (VaR) at a 97.5% confidence level over the fund's Recommended Holding Period (RHP). The VaR is then converted back into an annualized volatility metric called VaR-Equivalent Volatility (VEV) to secure the risk classification.
The basis for the VaR calculation is the Cornish-Fisher Expansion:

with:
VaR ... Value at Risk based on log-differences
N ... number of periods
σ ... standard deviation (2nd moment)
µ1 ... skewness (3rd moment)
µ2 ... excess kurtosis (4th moment)
Reiterating into VEV via:
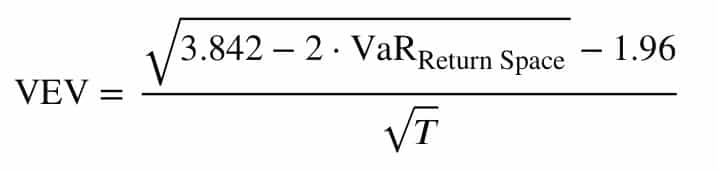
with:
T ... Recommended Holding Period
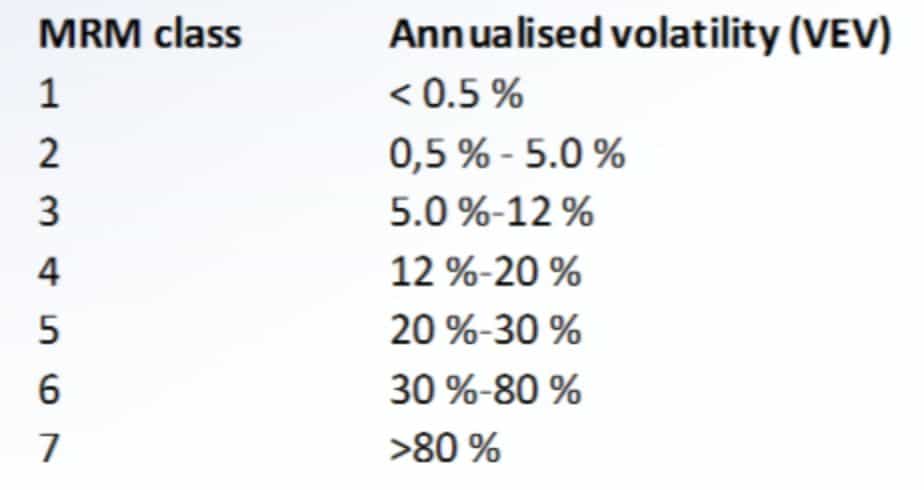
This dictates the risk classification according to PRIIPs (MRM classes):
The Illusion of Low Risk: Volatility
The MRM risk classification is based on a fund's Net Asset Value (NAV) development. The primary driver of NAV is the yield development of the underlying asset class.
Herein lies the flaw: In general, the update of property yields happens once a quarter, while the NAV (for retail funds) is published daily. Under ordinary market conditions, the daily NAV barely moves, giving the illusion of incredibly low volatility. The PRIIPs formula eats this data and spits out a "low risk" profile.
But let's approximate this risk classification system using the actual basic yield development of an asset class. Here is an example of an investment yield development over the last 20+ years:
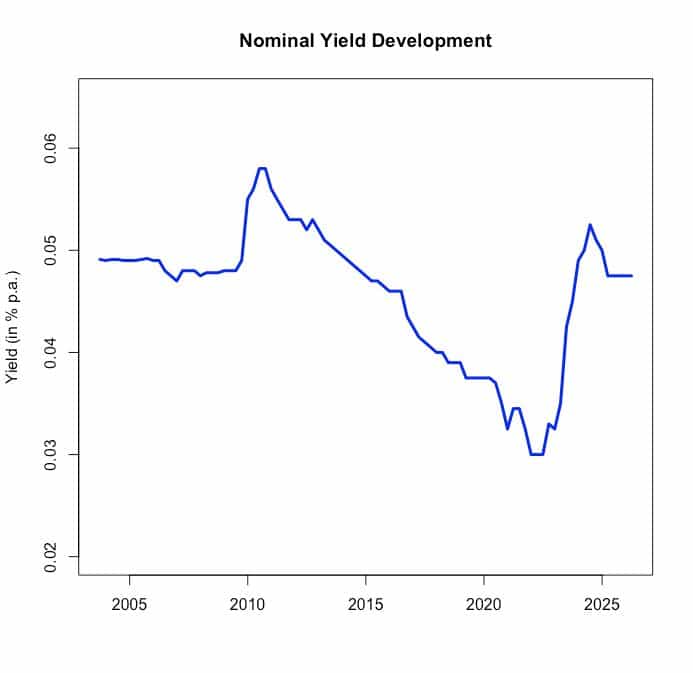
Notice that there are long periods of low variability interrupted by sharp, distinct yield changes.
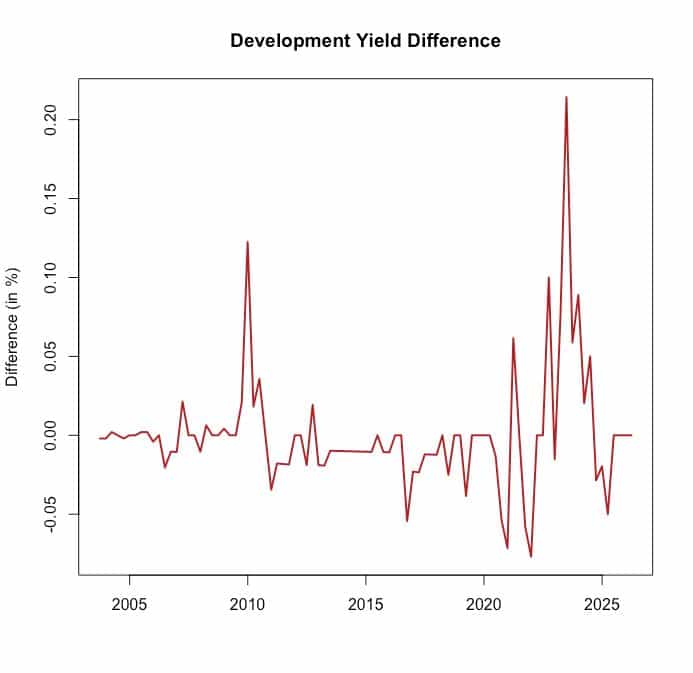
Because the true frequency of yield shifts is quarterly, not daily, the number of periods (N) in the formula above gets much smaller.
When we calculate the VaR-Equivalent Volatility for this actual investment yield, it equals 8.1% p.a. for a 5-year holding period. This immediately bumps the real-world risk into Class 3 (moderate-low), degrading the "low risk" label.
To put it into perspective: With a VaR at a 97.5% confidence level, there is a 2.5% chance that the loss of the invested equity capital is more than 31%. Here, some details:
- VaR(at 97.5%) = -0.3706 on logarithmic scale
- Asset Value (at 97.5%) = exp(-0.3706) = 0.6903,
i.e. appr. 69 % remaining asset value and
an expected overall loss over the holding period of more than 31%
with a 2.5% probability.
An expected overall loss of more than 31% over the holding period with a 2.5% probability doesn't sound like a "low risk" safe haven anymore.
The Illusion of Low Risk - Trend
Another critical factor is that in general commercial investment yields tend to follow trends. While experiencing a period of low variability, the investment yield might follow an upward trend, leading to a sustainable deterioration in market values.
To understand the consequences of those trend lines, we incorporated the empirc behavior of our example yield into a Markov-Switching Regime Change Model and ran a Monte Carlo simulation over a 5-year period. Again, the results are sobering:
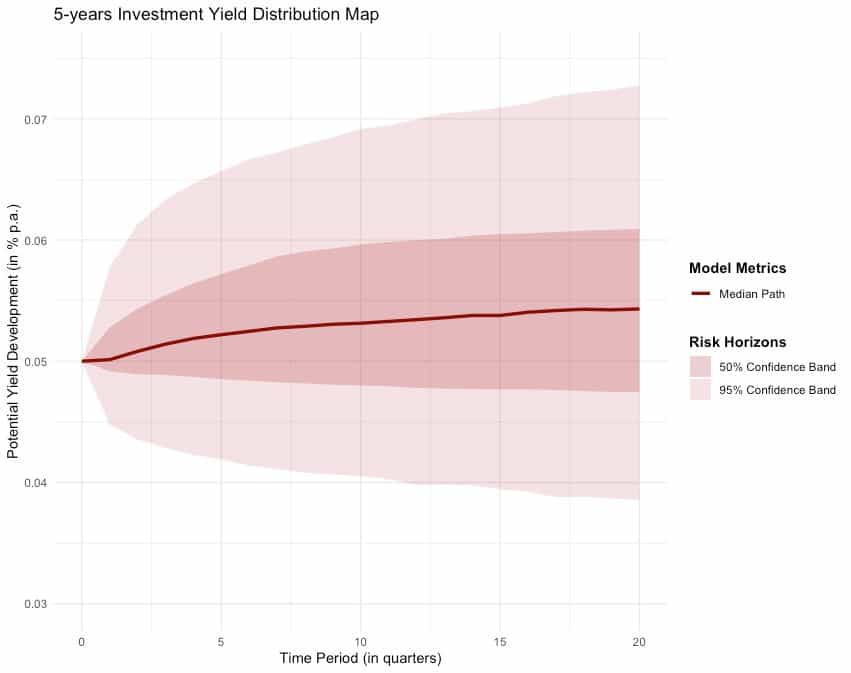
When entering an investment position during the wrong trend line, the risk of making a loss is close to 60% while Value at Risk (at 97.5%) amounts to -6.4% p.a. So, there is a 2.5% chance to make an overall loss of more than 32% during this investment period.
Even when yield developments are simulated under more favorable conditions, the Value at Risk at 97.5% confidence interval still holds at a significant 5.7% p.a.
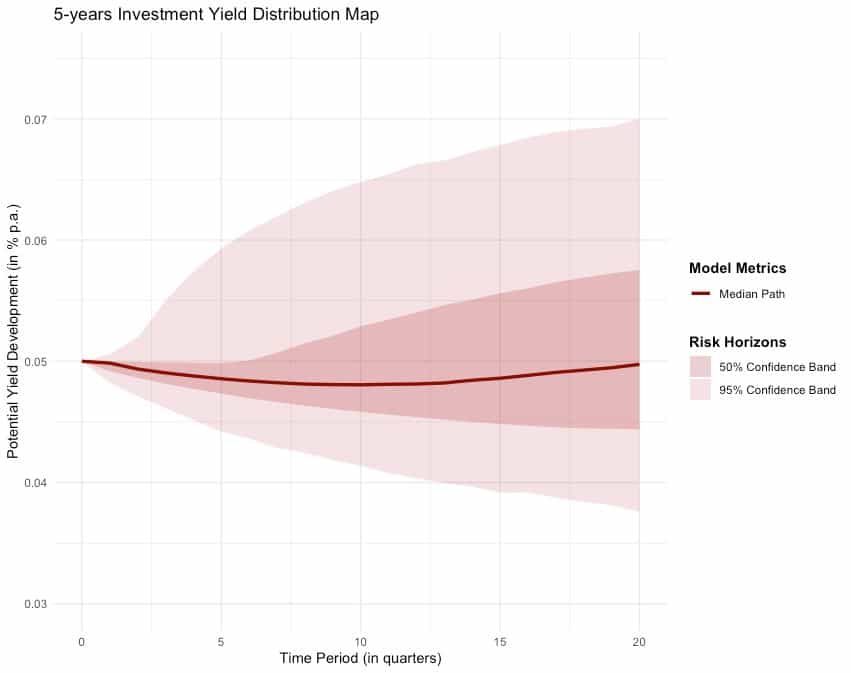
From this perspective as well, we are far from safety of a "moderate-low" risk profile.
The structural and mathematical blind spots of open-ended real estate funds are no longer just a topic for quantitative analysts. They have officially entered the courtroom.
In a landmark ruling, the Regional Court (Landgericht) of Nürnberg-Fürth (Az. 4 HK O 5879/24) ruled that a major asset manager could no longer market its open-ended real estate fund under the low-risk banner of an SRI 2 or 3. The court went as far as to label the low-risk classification a "Sicherheitsillusion" (illusion of safety), stating that given the true frequency of underlying property asset valuations, a Risk Class 6 - putting it on par with volatile equity funds - is legally justified. While the case has since been escalated to the European Court of Justice for a final systemic interpretation, the signal to the market is defeaning.
The current regulatory framework creates a dangerous blind spot. By relying on smoothed daily NAV data that masks the illiquid reality of real estate assets, the PRIIPs 1-to-7 scale provides a false sense of security.
An SRI of 2 out of 7 might satisfy historic compliance models, but it does not grant immunity from macroeconomic gravity. When yields shift and institutional capital heads for the door, the structural mismatch of open-ended funds is ruthlessly exposed, leaving retail investors trapped in frozen vehicles.
Efficient risk management isn't found in a smoothed regulatory formula. It is found in understanding market reality. For asset managers, distributors, and investors alike, the message is clear: It's time to stop selling illiquidity wrapped in the illusion of low risk.