


Open-Ended Real Estate Funds: When Numbers Stay Too Calm
Structure, liquidity, and the illusion of safety in open-ended real estate funds
Across the open-ended real estate fund segment, one word returns in almost every conversation: the trust. It appears wherever the current equity strain is discussed, and its restoration is often described as the way out of the capital drain.
The instinct behind that word is understandable and it can be something a fund earns through its own conduct given the often mentioned disadvantage of its business model, which rests on a known structural tension: long-term, illiquid assets are funded by capital that can be withdrawn at short notice. Given that tension, and given recent events across the segment, the clearest signal of trustworthiness would have to come from the funds themselves. One very obvious and visible way would be shown in the picture on how faithfully their numbers track the market around them.
On that measure, the current situation invites some questions. Across the segment, published valuations reflect present conditions only partially. In certain cases the gap is wider than partial. The reported value does not simply lag the market; over recent years it has continued to rise while the market has moved the other way.
This piece tests that claim against a single fund of a common profile: first against the market around it, then against its own structure.
1. The divergence
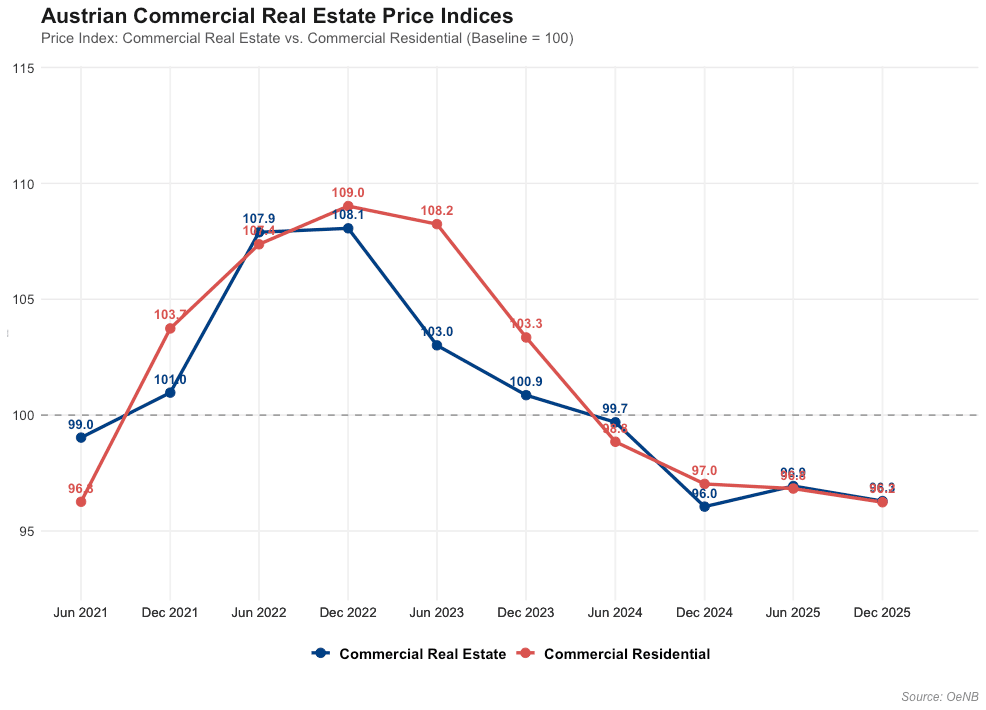
Reading a fund against the market first requires a measure of the market that no single fund controls. The OeNB Commercial Real Estate Price Index serves that purpose. It covers the period from June 2021 to December 2025, and it shows a clear decline from the middle of 2022, coinciding with the start of the ECB rate-tightening cycle. Both the commercial real estate and the commercial residential series fall from a peak near 108 to 109 at the end of 2022 to roughly 96 by the end of 2025. Depending on the asset class, the reduction from the mid-2022 peak runs between roughly 9 and 14 percent. Germany shows a broadly comparable pattern over the same period.
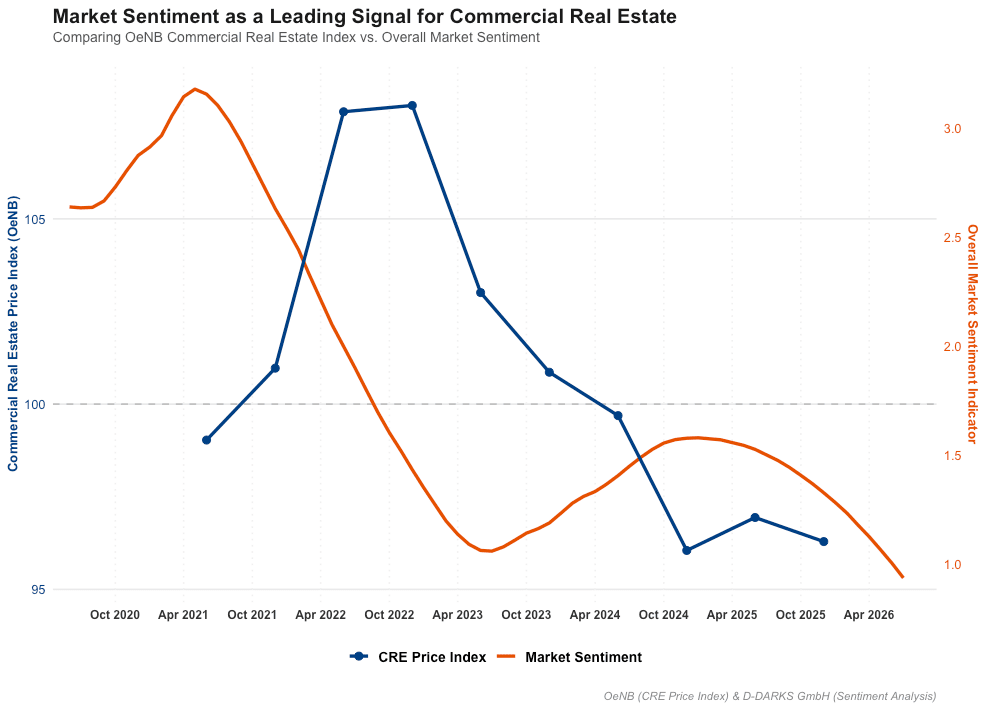
At this point, the official index only covers the period till December 2025. To fill the gap to the present, mid-2026, and to see where prices are heading next, we turn to the D-DARKS Market Sentiment Index, which gives no sign of improvement through the remainder of 2026. Measured consistently from institutional and market communication, sentiment has anticipated the turns in the price index before, at the peak and again at the low. Right now it is falling again, which suggests prices will weaken further rather than recover in 2026.
Set against that backdrop, consider a fund of a common profile. It carries a daily NAV quotation and holds commercial real estate in Germany and Austria. Close to half of the portfolio consists of office assets, with another 15 percent in commercial residential assets. In composition, the fund comes close to what the OeNB index represents. Its NAV, driven mainly by the appraisal-based valuation of the underlying assets, nevertheless shows uninterrupted appreciation across the same period, and across the two decades before it.
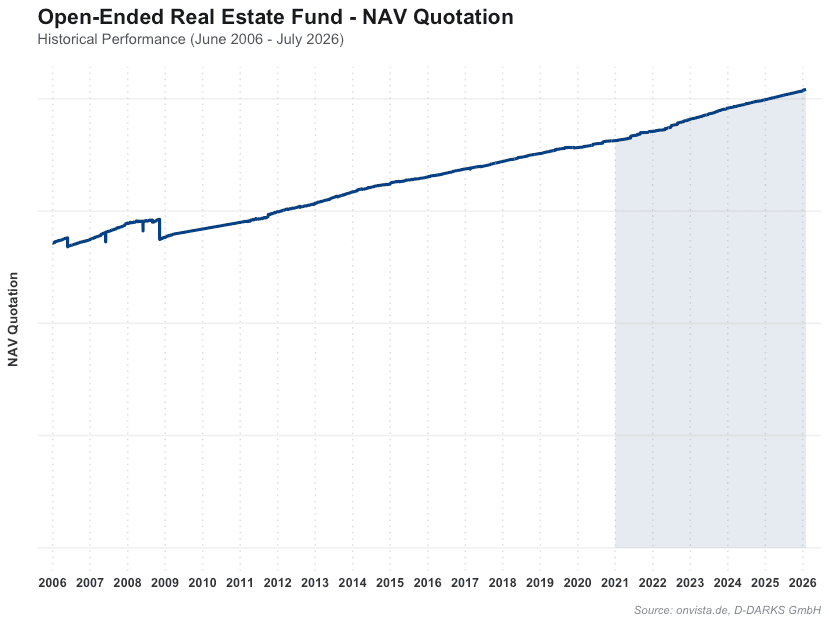
So here, two independent readings of the market point down, and the fund points up. The question worth asking is a plain one. What mechanism allows an appraisal-based NAV to remain insulated from a market its own portfolio closely tracks?
2. The portfolio and the timing
Part of the answer rests in the timing of acquisition. A fund of this profile typically follows a pro-cyclical strategy. When setting the timing of the portfolio purchase against prime office yields in Vienna and Frankfurt, the concentration becomes clear. The bulk of the portfolio was acquired roughly between 2016 and 2021, when prime yields stood well below current levels. Around 80 percent was bought into that low-yield window. Prime yields have since risen back toward, and past, their levels of a decade earlier.
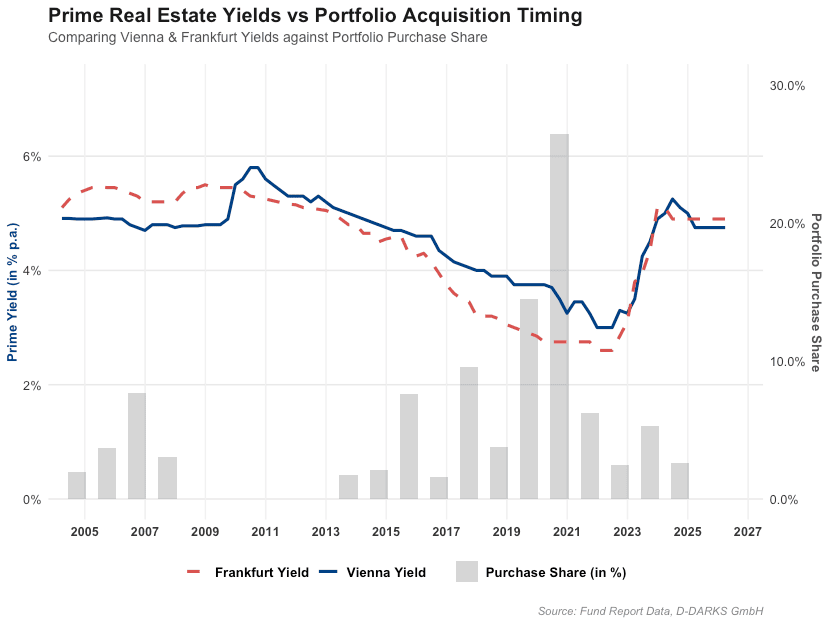
Cyclical behaviour tends to have consequences in both directions. Inflation lifts rents and, in turn, supports valuations, yet that support does not offset the heavy yield shift of the past two to three years. The fund’s reporting bears this out in a particular way. Devaluations and revaluations across the portfolio net out to a negligible overall effect, while the NAV continues its slow and steady rise. The result is a number that stays calm while the market underneath it moves.
3. The liquidity mechanism
Operationally, a portfolio of this kind can look sound. Occupancy near 95 percent meets the benchmark of peer funds. Operating cash flow remains positive, though in the first half of 2026 gets noticeably reduced by maintenance costs. The strain, therefore, does not originate in operations, but on the liability side of the fund.
The Cash Flows below are shown as representative of that profile. They make the underlying pattern legible:
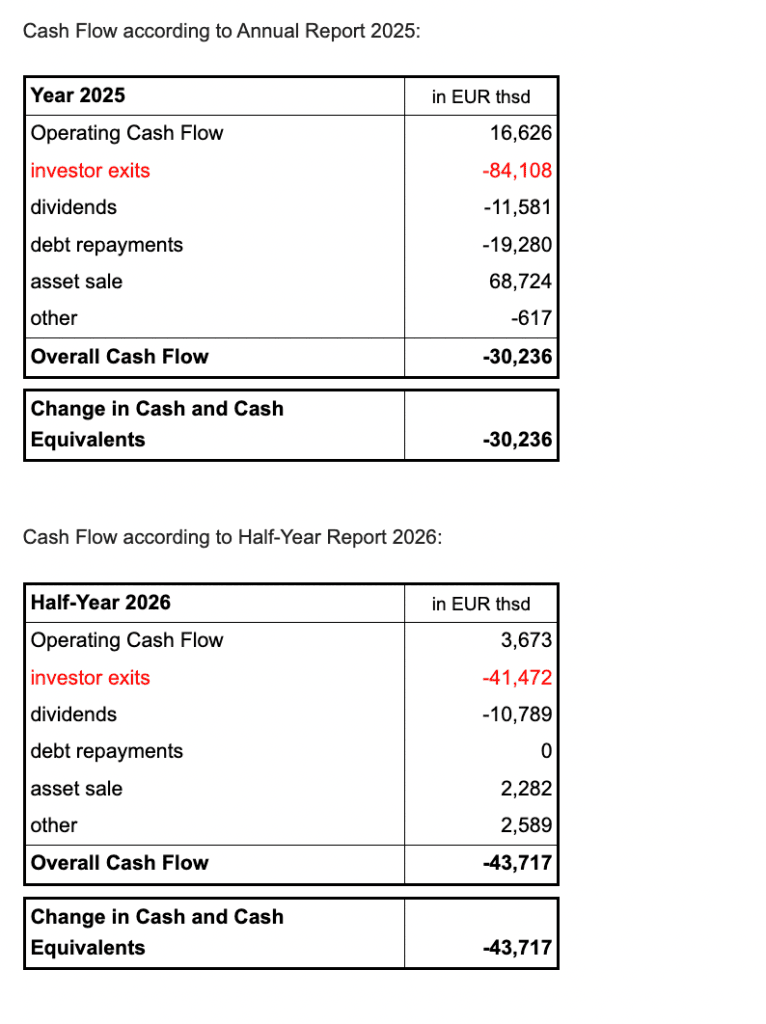
Two figures carry this section. Over eighteen months, net investor exits reach roughly EUR 125 million. Together with dividends and debt service, the fund draws down more than 40 percent of its cash and cash-equivalent position during this short period. The six-month drain in the first half of 2026 already exceeds the full-year drain of 2025.
The asset side does not keep pace with that demand. Sale proceeds in 2025 already lagged behind cash requirements. In the first half of 2026 no major sale was completed. Two disposals were announced without published prices, and the associated debt repayments still fall due within the year. The 2025 sales realised a slight loss, modest in isolation, though less so read as a leading indicator under continued pressure.
This is the structural point, and it belongs to no single manager. Long-term, illiquid assets are funded by equity that can be redeemed at short notice. While the rating framework stays benign, that mismatch remains invisible. When it turns, redemptions convert an appraisal-stable NAV into a liquidity problem, and disposals into forced disposals.
4. What the structure produces
A NAV that rises through a falling market does not remove the risk, but it relocates it, from the price itself to the moment the price finally moves. That is the illusion of safety expressed in a single line: the number looks calmest precisely where the exposure is building.
For a fund of this profile, the consequences fall on the remaining investors rather than the departing ones. Leaving investors are paid out at a NAV that has not yet reflected the market. Should redemption pressure persist and disposals continue to lag, the fund may need to reach out for liquidity measures. Remaining investors would then face the risk of abrupt NAV corrections, delayed access to their capital, or both together. Upcoming changes to the investment fund law framework, effective from the beginning of 2027 (read more about it here) are widely expected to add to redemption pressure in the short run rather than relieve it.
Here the structure meets its own limit. Valuation of this kind is event-based and, by design, backward-looking. It records the strain only after the fact. The market's own signals move well earlier, as Section 1 showed with the sentiment reading. They appear ahead of the appraisal that eventually confirms them. That interval, between what the market already indicates and what the NAV has yet to record, is the whole difference between managing an exposure and being overtaken by one.