
Close
Die Geschichte wiederholt sich nie, aber sie reimt sich oft. Wieder einmal beherrschen Liquiditätsprobleme bei offenen Immobilienfonds die Schlagzeilen. Für erfahrene Marktbeobachter erinnert die aktuelle Lage unangenehm an die dunklen Tage der Finanzkrise 2008.
Wie die jüngste Medienberichterstattung zeigt, stehen offene Immobilienfonds wieder im Rampenlicht – leider aus den falschen Gründen. So weist etwa auch die aktuelle Scope-Marktstudie auf die wachsenden strukturellen Belastungen im Sektor hin (siehe auch: https://saprodscopeexplorer01.blob.core.windows.net/public/reports-links/Scope_Offene_Immobilienfonds_Gesamtmarktstudie_2026.pdf).
Für den durchschnittlichen Anleger ergibt sich daraus ein eklatantes Paradoxon. Wirft man einen Blick in das Marketingmaterial oder die Fondsunterlagen dieser Vehikel, findet man häufig eine Risikoklassifizierung (Summary Risk Indicator, SRI) von 2 (von insgesamt 7 Risikoklassen) und damit die Einstufung als „niedriges Risiko".
Wie kann ein als risikoarm eingestuftes Produkt plötzlich mit Fondsschließungen und der Aussetzung von Anteilsrücknahmen konfrontiert sein, sobald es am Markt etwas rauer wird?
Um zu verstehen, warum offene Fonds von Natur aus fragil sind, müssen wir ihren grundlegenden strukturellen Widerspruch betrachten: die Aktiv-Passiv-Asymmetrie.
Ein offener Immobilienfonds hält entweder Bestandsimmobilien oder Beteiligungen an Objektgesellschaften. Diese Vermögenswerte sind weniger liquide. Der Ein- oder Ausstieg dauert oft mehrere Monate, wenn nicht sogar länger. Auf der anderen Seite der Bilanz ist das Eigenkapital des Fonds theoretisch liquide: Anleger erwarten, ihr Kapital relativ kurzfristig abziehen zu können. Daraus entsteht eine kritische Fristeninkongruenz, die bei ungünstigen Marktentwicklungen sehr schnell bedrohlich werden kann.
Eine aktuelle Studie zu den Kapitalflüssen offener Immobilienfonds der IREBS Immobilienakademie hebt zwei weitere kritische Punkte hervor, die dieses strukturelle Problem zusätzlich verschärfen (siehe auch: https://epub.uni-regensburg.de/78310/1/Heft%2032.pdf):
Wie halten Fonds trotz allem ein risikoarmes Profil aufrecht? Dazu müssen wir die Mechanik des PRIIPs-Regelwerks (PRIIPs = Packaged Retail and Insurance-based Investment Products) betrachten.
Die SRI-Berechnung besteht aus zwei wesentlichen Komponenten:
Bei offenen Immobilienfonds wird das Marktrisiko über den Value-at-Risk (VaR) bei einem Konfidenzniveau von 97,5 % über die empfohlene Haltedauer (Recommended Holding Period, RHP) gemessen. Der VaR wird anschließend in eine annualisierte Volatilitätskennzahl rückgerechnet, die VaR-äquivalente Volatilität (VaR-Equivalent Volatility, VEV), um die endgültige Risikoklassifizierung vornehmen zu können.
Grundlage der VaR-Berechnung ist die Cornish-Fisher-Expansion:
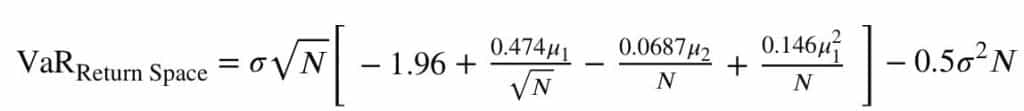
mit:
Überführung in die VEV mittels:
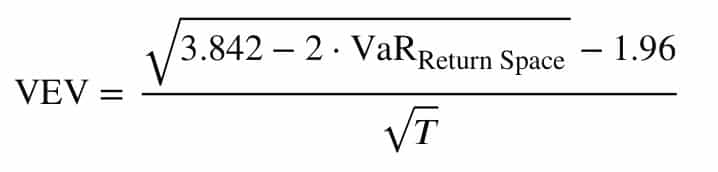
mit:
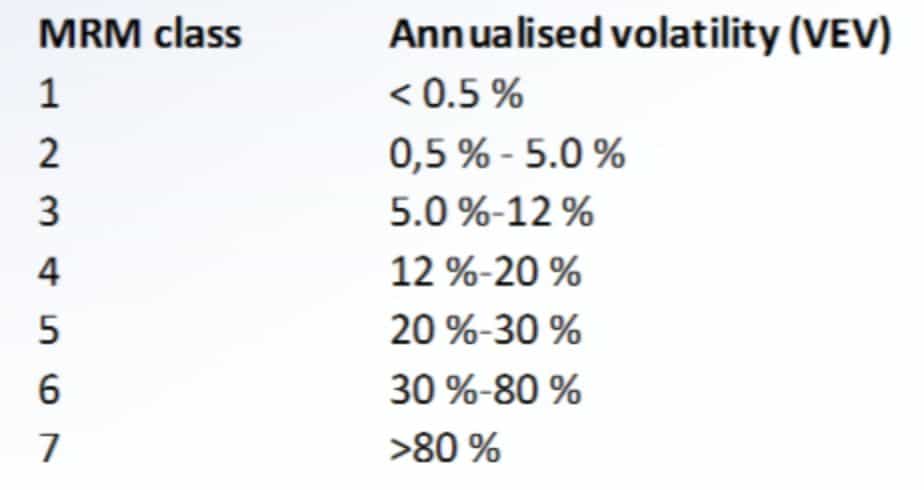
Daraus ergibt sich folgende Risikoklassifizierung nach PRIIPs (MRM-Klassen):

Die MRM-Risikoklassifizierung basiert auf der Entwicklung des Net Asset Values (NAV) eines Fonds. Der wesentliche Treiber des NAV ist die Renditeentwicklung der zugrunde liegenden Anlageklasse.
Hier liegt aber schon ein wesentlicher Schwachpunkt: In der Regel werden die Immobilienrenditen einmal pro Quartal aktualisiert, während der NAV (bei Publikumsfonds) täglich veröffentlicht wird. Unter gewöhnlichen Marktbedingungen bewegt sich der tägliche NAV kaum und erzeugt so die Illusion einer ausgesprochen geringen Volatilität. Die PRIIPs-Formel verarbeitet diese Daten und errechnet ein „risikoarmes" Profil.
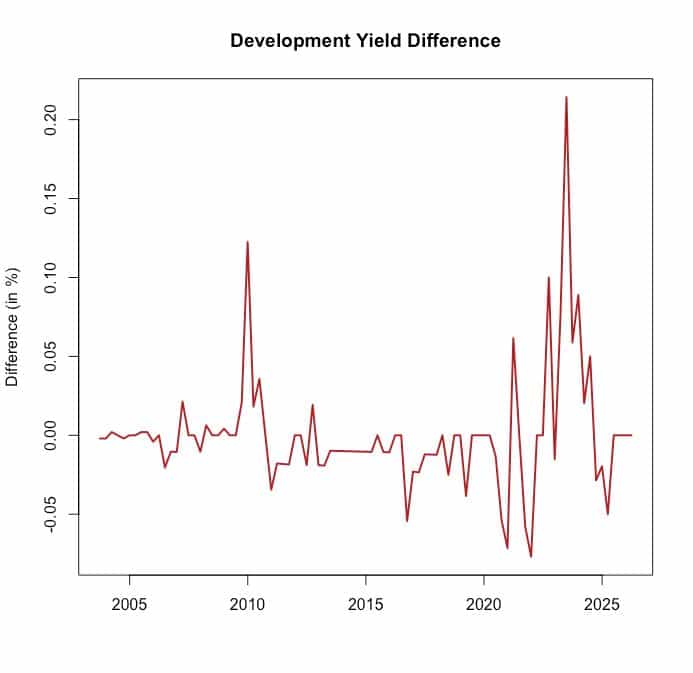
Doch nähern wir uns dieser Risikoklassifizierung anhand der tatsächlichen Renditeentwicklung einer Anlageklasse an. Hier ein Beispiel einer Immobilienrendite mit einem Zeitraum von über 20 Jahren:
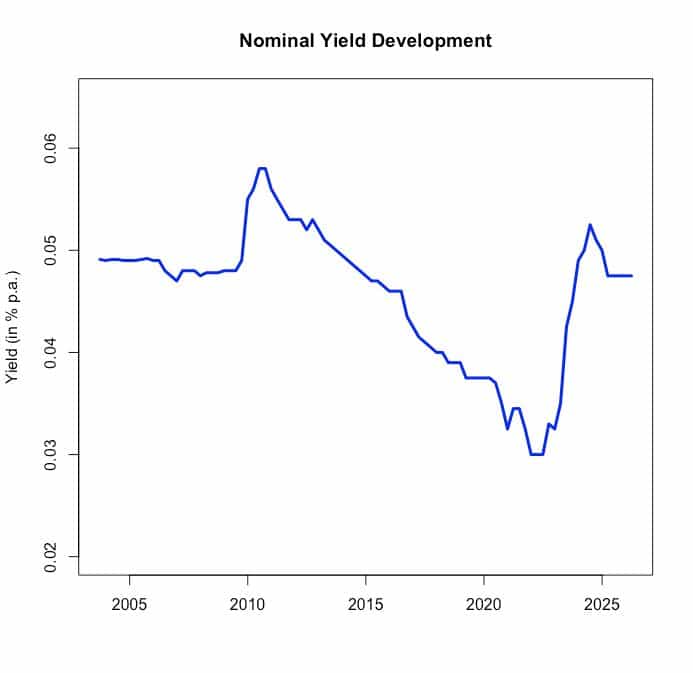
Man beachte die langen Phasen geringer Schwankung, unterbrochen von scharfen, deutlichen Renditeänderungen.

Da die tatsächliche Frequenz der Renditeveränderungen quartalsweise und nicht täglich ist, fällt die Anzahl der Perioden (N) in der PRIIPs-Formel deutlich geringer aus. Das hat natürlich auch Auswirkung auf die Risikoklassifizierung selbst.
Berechnen wir die VaR-äquivalente Volatilität für diese Veranlagungsrendite mit der nunmehr niedrigeren Frequenz (niedrigeres N), so ergibt sich ein VEV in Höhe von 8,1 % p.a. bei einer Haltedauer von fünf Jahren. Damit haben wir bereits eine Verschiebung in die Risikoklasse 3, also von "niedriges Risiko" (Klasse 2) hin zu "mittleres Risiko" (Klasse 3).
Zur Einordnung: Bei einem VaR mit einem Konfidenzniveau von 97,5 % besteht eine Wahrscheinlichkeit von 2,5 %, dass der Verlust des eingesetzten Eigenkapitals mehr als 31 % beträgt. Im Detail:
Ein erwarteter Gesamtverlust von mehr als 31 % über die Haltedauer bei einer Wahrscheinlichkeit von 2,5 % klingt nicht mehr nach einem risikoarmen und sicheren Hafen.
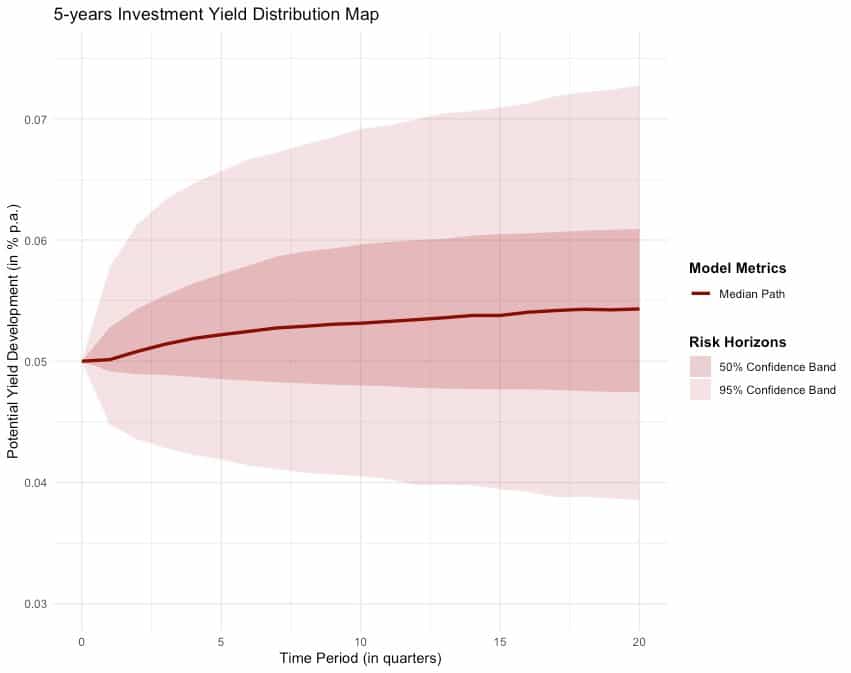
Ein weiterer kritischer Faktor: Gewerbliche Investitionsrenditen folgen in der Regel Trends. So kann etwa während einer Phase geringer Schwankung die Rendite einem Aufwärtstrend folgen, was zu einer nachhaltigen Verschlechterung der Marktwerte führen kann.
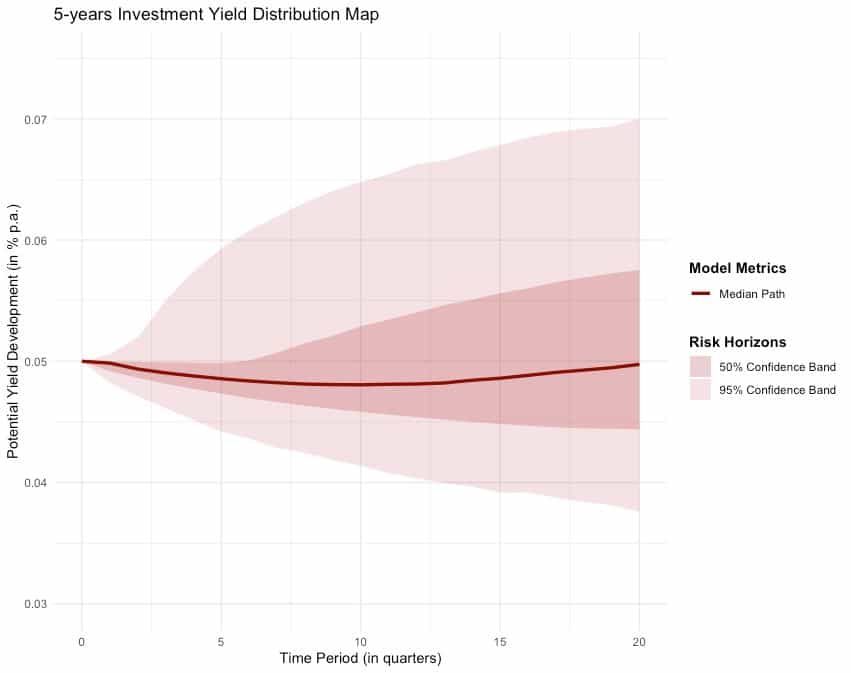
Um die Konsequenzen dieser Trendlinien zu verstehen, haben wir das empirische Verhalten unserer Beispielrendite in ein Markov-Switching-Regimewechsel Modell überführt und eine Monte-Carlo-Simulation über einen Zeitraum von fünf Jahren durchgeführt. Auch hier sind die Ergebnisse ernüchternd:
Steigt man im falschen Markttrend in eine Position ein, liegt das Verlustrisiko bei nahezu 60 %, während der Value at Risk (bei 97,5 %) -6,4 % p.a. beträgt. Es besteht also eine Wahrscheinlichkeit von 2,5 %, über diesen Veranlagungszeitraum einen Gesamtverlust von mehr als 32 % zu erleiden.
Selbst wenn die Renditeentwicklungen unter günstigeren Bedingungen simuliert werden, hält der Value at Risk bei einem Konfidenzniveau von 97,5 % immer noch bei signifikanten -5,7 % p.a.

Auch aus dieser Perspektive sind wir weit von der Sicherheit eines „niedrigen" Risikoprofils entfernt.
Diese strukturellen und mathematischen Schwachstellen offener Immobilienfonds sind längst kein Thema mehr allein für quantitative Analysten. Sie haben offiziell den Gerichtssaal erreicht.
In einem wegweisenden Urteil entschied das Landgericht Nürnberg-Fürth (Az. 4 HK O 5879/24), dass ein großer Asset Manager einen seiner offenen Immobilienfonds nicht länger unter dem Label des geringen Risikos (nicht mehr SRI 2 und auch nicht SRI 3) vermarkten darf. Das Gericht ging so weit, die Niedrigrisiko-Einstufung als „Sicherheitsillusion" zu bezeichnen, und stellte fest, dass angesichts der tatsächlichen Frequenz der zugrunde liegenden Liegenschaftsbewertungen eine Risikoklasse 6 – gleichauf mit volatilen Aktienfonds – rechtlich gerechtfertigt sei. Der Fall wurde inzwischen zur abschließenden systemischen Auslegung an den Europäischen Gerichtshof verwiesen und ist damit noch offen. Die Signalwirkung im Markt ist allerdings unüberhörbar.
Die aktuelle Berechnungsmethodik schafft einen gefährlichen blinden Fleck. Indem es sich auf geglättete tägliche NAV-Daten stützt, die die illiquide Realität von Immobilienvermögen verschleiern, vermittelt die PRIIPs-Skala von 1 bis 7 ein trügerisches Gefühl der Sicherheit.
Ein SRI von 2 mag historische Compliance-Modelle zufriedenstellen, gewährt aber keine Immunität gegen die makroökonomische Schwerkraft. Wenn sich die Renditen verschieben und institutionelles Kapital den Ausgang sucht, wird die strukturelle Inkongruenz offener Fonds schonungslos offengelegt und lässt Privatanleger in eingefrorenen Vehikeln zurück.
Effizientes Risikomanagement findet sich nicht in einer geglätteten regulatorischen Formel. Es findet sich im Verständnis der Marktrealität. Für Asset Manager, Vertriebspartner und Anleger gleichermaßen lautet die Botschaft klar: Es ist an der Zeit, damit aufzuhören, fehlende Liquidität verpackt in der Illusion eines geringen Risikos zu verkaufen.
History doesn't always repeat itself, but often rhymes. Once again, headlines are buzzing with liquidity issues plaguing open-ended real estate funds. For seasoned market observers, the current situation feels uncomfortably similar to the dark days of the 2008 Financial Crisis.
As highlighted by recent media coverage, open-ended real estate funds are back in the spotlight for all the wrong reasons. Additionally, the latest comprehensive Scope Market Study (https://saprodscopeexplorer01.blob.core.windows.net/public/reports-links/Scope_Offene_Immobilienfonds_Gesamtmarktstudie_2026.pdf) maps out the mounting structural pressures across the sector.
This leaves everyday investors with a glaring paradox. If you look at the fundamental marketing and regulatory documents for these vehicles, one will frequently find a Summary Risk Indicator (SRI) of 2 out of 7 classifying them as "low risk".
How can a product labeled as low-risk suddenly face fund suspensions and freeze redemptions when market headwinds pick up?
To understand why open-ended funds are inherently fragile, we have to look at their basic structural mismatch: asset-liability asymmetry.
An open-ended real estate fund owns either brick-and-mortar buildings or stakes in asset holding companies. These assets are less liquid. Investing in or exiting them often takes several months, if not longer. On the other side of the balance sheet, the fund's equity capital is theoretically liquid: investors expect to be able to withdraw their money on relatively short notice. This creates a critical funding mismatch that breaks down during market downturns.
A recent study on equity flows in open-ended real estate funds conducted by the IREBS Institute for Real Estate and Investment highlights two additional critical phenomena that aggravate this structural trap (see also: https://epub.uni-regensburg.de/78310/1/Heft%2032.pdf):
- Correlated Outflows ("The Run for the Door"): Under normal market conditions, investors inflows and outflows are independent, random events that balance each other out. However, when bad news hit the market, herd behavior takes over. Otherwise independent actions suddenly become heavily correlated. When the "run for the door" gains momentum, capital flees simultaneously, devastating the fund's cash reserves with all the consequences we faced during the Financial Crisis and are experiencing again today.
- The Institutional Advantage: Institutional investors move significantly faster than retail investors in both directions. According to the study, institutional investors are quicker to build up their investments, but they are also the first to head for the exits when things go south leaving retail investors to bear the brunt of the illiquidity.
How do funds maintain a low-risk profile despite such severe liquidity traps? We have to look at the regulatory mechanics of the Packaged Retail and Insurance-based Investment Products (PRIIPs) framework.
The SRI calculation consists of two primary components:
- Credit Risk: The risk of the management company defaulting (a minor risk here, as fund assets are legally segregated from the managing entity).
- Market Risk Measure (MRM): MRM is primarily measured by historical volatility to determine the final 1 to 7 SRI score.
For open-ended real estate funds, market risk is measured via Value-at-Risk (VaR) at a 97.5% confidence level over the fund's Recommended Holding Period (RHP). The VaR is then converted back into an annualized volatility metric called VaR-Equivalent Volatility (VEV) to secure the risk classification.
The basis for the VaR calculation is the Cornish-Fisher Expansion:

with:
VaR ... Value at Risk based on log-differences
N ... number of periods
σ ... standard deviation (2nd moment)
µ1 ... skewness (3rd moment)
µ2 ... excess kurtosis (4th moment)
Reiterating into VEV via:

with:
T ... Recommended Holding Period
This dictates the risk classification according to PRIIPs (MRM classes):
The Illusion of Low Risk: Volatility
The MRM risk classification is based on a fund's Net Asset Value (NAV) development. The primary driver of NAV is the yield development of the underlying asset class.
Herein lies the flaw: In general, the update of property yields happens once a quarter, while the NAV (for retail funds) is published daily. Under ordinary market conditions, the daily NAV barely moves, giving the illusion of incredibly low volatility. The PRIIPs formula eats this data and spits out a "low risk" profile.
But let's approximate this risk classification system using the actual basic yield development of an asset class. Here is an example of an investment yield development over the last 20+ years:

Notice that there are long periods of low variability interrupted by sharp, distinct yield changes.
Because the true frequency of yield shifts is quarterly, not daily, the number of periods (N) in the formula above gets much smaller.
When we calculate the VaR-Equivalent Volatility for this actual investment yield, it equals 8.1% p.a. for a 5-year holding period. This immediately bumps the real-world risk into Class 3 (moderate-low), degrading the "low risk" label.
To put it into perspective: With a VaR at a 97.5% confidence level, there is a 2.5% chance that the loss of the invested equity capital is more than 31%. Here, some details:
- VaR(at 97.5%) = -0.3706 on logarithmic scale
- Asset Value (at 97.5%) = exp(-0.3706) = 0.6903,
i.e. appr. 69 % remaining asset value and
an expected overall loss over the holding period of more than 31%
with a 2.5% probability.
An expected overall loss of more than 31% over the holding period with a 2.5% probability doesn't sound like a "low risk" safe haven anymore.
The Illusion of Low Risk - Trend
Another critical factor is that in general commercial investment yields tend to follow trends. While experiencing a period of low variability, the investment yield might follow an upward trend, leading to a sustainable deterioration in market values.
To understand the consequences of those trend lines, we incorporated the empirc behavior of our example yield into a Markov-Switching Regime Change Model and ran a Monte Carlo simulation over a 5-year period. Again, the results are sobering:

When entering an investment position during the wrong trend line, the risk of making a loss is close to 60% while Value at Risk (at 97.5%) amounts to -6.4% p.a. So, there is a 2.5% chance to make an overall loss of more than 32% during this investment period.
Even when yield developments are simulated under more favorable conditions, the Value at Risk at 97.5% confidence interval still holds at a significant 5.7% p.a.
From this perspective as well, we are far from safety of a "moderate-low" risk profile.
The structural and mathematical blind spots of open-ended real estate funds are no longer just a topic for quantitative analysts. They have officially entered the courtroom.
In a landmark ruling, the Regional Court (Landgericht) of Nürnberg-Fürth (Az. 4 HK O 5879/24) ruled that a major asset manager could no longer market its open-ended real estate fund under the low-risk banner of an SRI 2 or 3. The court went as far as to label the low-risk classification a "Sicherheitsillusion" (illusion of safety), stating that given the true frequency of underlying property asset valuations, a Risk Class 6 - putting it on par with volatile equity funds - is legally justified. While the case has since been escalated to the European Court of Justice for a final systemic interpretation, the signal to the market is defeaning.
The current regulatory framework creates a dangerous blind spot. By relying on smoothed daily NAV data that masks the illiquid reality of real estate assets, the PRIIPs 1-to-7 scale provides a false sense of security.
An SRI of 2 out of 7 might satisfy historic compliance models, but it does not grant immunity from macroeconomic gravity. When yields shift and institutional capital heads for the door, the structural mismatch of open-ended funds is ruthlessly exposed, leaving retail investors trapped in frozen vehicles.
Efficient risk management isn't found in a smoothed regulatory formula. It is found in understanding market reality. For asset managers, distributors, and investors alike, the message is clear: It's time to stop selling illiquidity wrapped in the illusion of low risk.
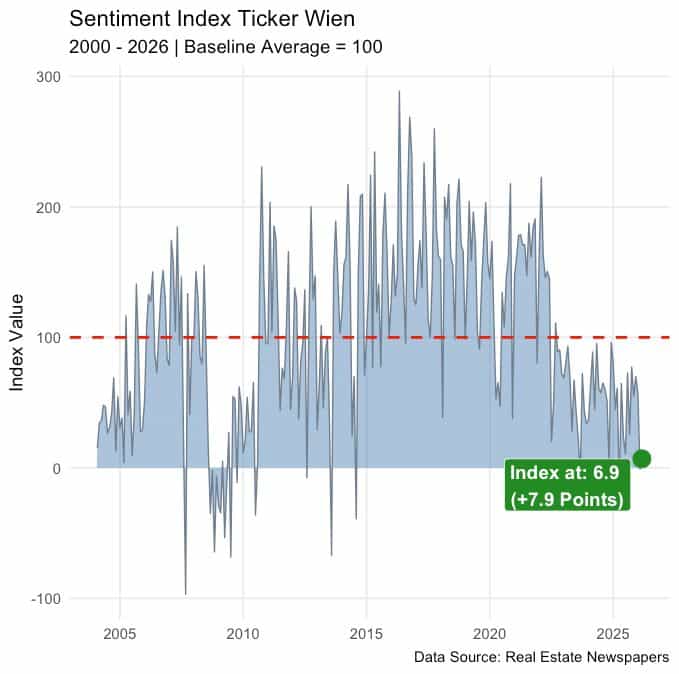
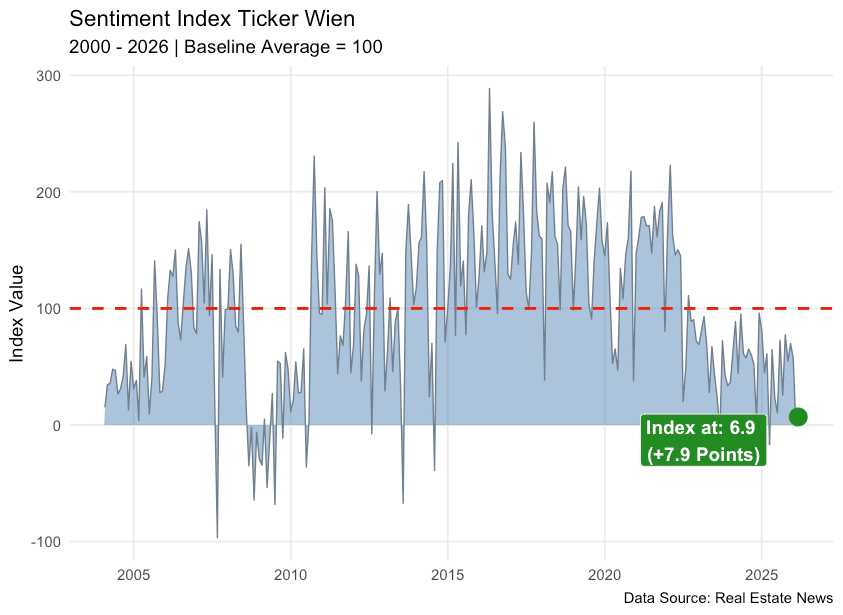
Austrian commercial real estate market sentiment at a glance: The D-DARKS CRE Sentiment Index for Austrian commercial real estate has dropped to 14.6 points in April 2026, a plunge of 43.1 points versus the previous month. Despite seemingly positive transaction data, the qualitative market sentiment tells a completely different story: not a recovery, but structural resignation.
| Indicator | Value | Assessment |
|---|---|---|
| Sentiment Index | –14.6 points | Negative |
| Month-on-month change | –43.1 points | Sharp decline |
| Market trend | Pessimistic corridor | No recovery |
| Primary catalyst | Geopolitics (Middle East) | External shock |
At the start of 2026, voices within the Austrian commercial real estate industry increasingly spoke of a recovery or even of a new property cycle. This view was supported above all by a transaction volume of approximately EUR 540 million in the first quarter of 2026, roughly 37% higher than the same period a year earlier.
But this optimism is deceptive. Commercial real estate transactions typically require six to nine months from initial expression of interest to closing. The deals we see in today's statistics therefore reflect market expectations from mid-2025, not the current sentiment landscape.
This also explains why gross yields across individual asset classes (office, retail, hotel, logistics) currently still appear stable at high levels, despite the deteriorating overall picture.
The D-DARKS CRE Sentiment Index is based on systematic NLP analysis of 25 years of German-language commercial real estate news. In April 2026, the index sends a clear warning signal:
For the first time in a long while, market sentiment has turned negative. The index underscores how persistently depressed expectations in the Austrian commercial real estate market have become.
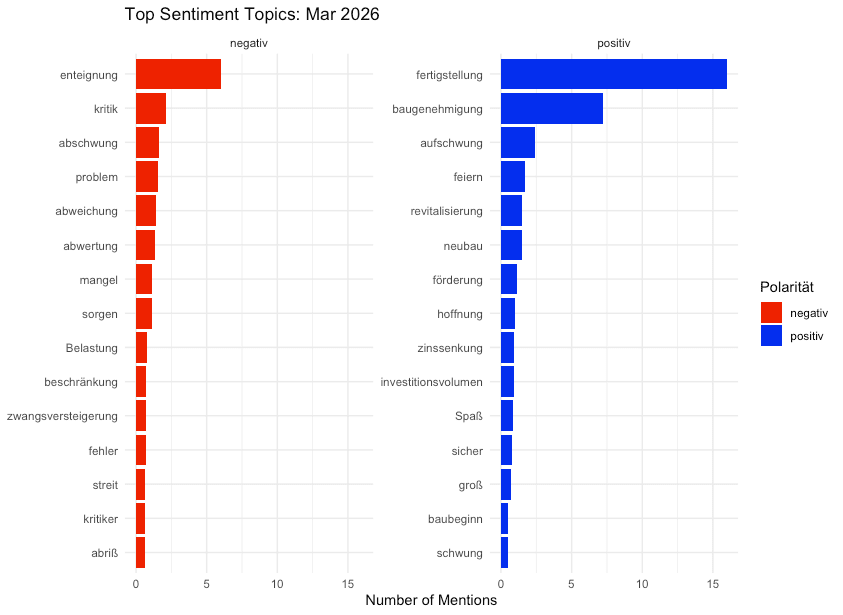
Quantitative topic analysis reveals a sudden dominance of negative terminology, while positive voices have effectively imploded. The five most frequently cited negative terms in April 2026:
Particularly noteworthy: terms like "panic" and "recession" are no longer mentioned only by isolated voices, but are now used across a broad spectrum of market participants. The Middle East conflict acts as a catalyst, amplifying pre-existing concerns.
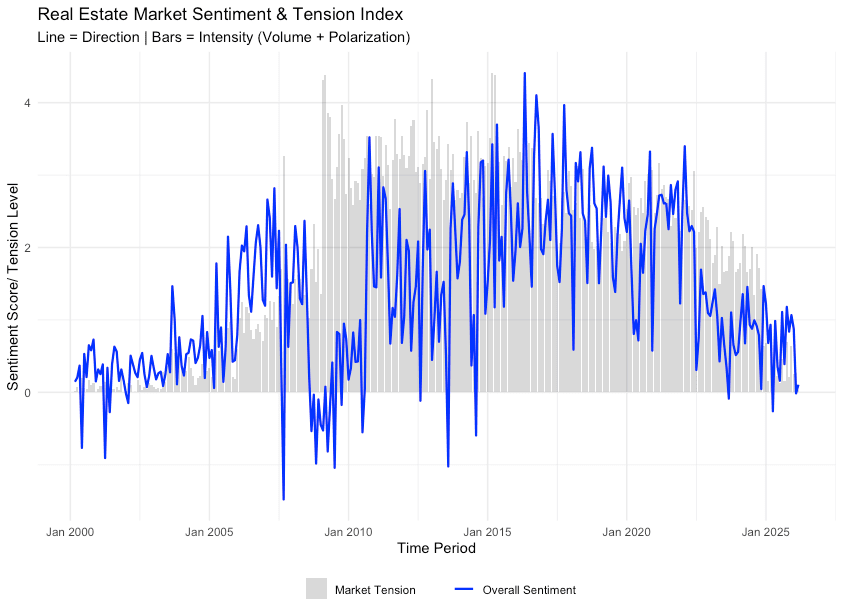
Unlike during the 2007/2008 financial crisis, the Austrian commercial real estate market in spring 2026 shows no signs of acute shock. The D-DARKS stress level, a combined indicator of sentiment and volatility, remains relatively low despite the negative mood.
What does this mean? Market participants have collectively adjusted to the bad news. There are barely any meaningful counter-voices or fundamental uncertainty about the future direction of the market. The industry is no longer drifting toward pessimism temporarily, sentiment has now structurally locked itself into a pessimistic corridor.
Should this trend solidify, the following developments are likely:
Expectations drive price formation, particularly in commercial real estate. Those who recognize early in which direction the market narrative is shifting gain a decisive lead-time advantage over backward-looking transaction data.
The market is not in recovery mode but has structurally locked into a pessimistic corridor. The D-DARKS CRE Sentiment Index stands at –14.6 points in April 2026.
Q1 2026 transactions reflect market expectations from 6–9 months earlier. Current sentiment will therefore only show up in transaction volumes with a significant time lag.
Not at the moment. Unlike in the 2007/2008 financial crisis, stress levels are low. There is no panic, but a consolidated resignation among market participants.
Gross yields for office, retail, hotel and logistics currently still hold at high levels, but an adjustment over the coming quarters is likely.
The Austrian commercial real estate market is sending a clear warning in April 2026. Those who rely solely on backward-looking transaction data risk missing the structural shift in market expectations. Qualitative market intelligence becomes the decisive early-warning tool for institutional investors.
Disclaimer: This article is based on NLP-driven sentiment analysis of German-language commercial real estate news (monthly data 2000–2026) and does not constitute investment advice.
Gewerbeimmobilien Österreich Marktstimmung auf einen Blick: Der D-DARKS CRE Sentiment Index für Gewerbeimmobilien in Österreich bricht im April 2026 auf –14,6 Punkte ein – ein Absturz von 43,1 Punkten gegenüber dem Vormonat. Trotz scheinbar positiver Transaktionsdaten zeigt die qualitative Marktstimmung ein völlig anderes Bild: keine Erholung, sondern strukturelle Resignation.
| Indikator | Wert | Bewertung |
|---|---|---|
| Sentiment Index | –14,6 Punkte | Negativ |
| Veränderung zum Vormonat | –43,1 Punkte | Einbruch |
| Markttrend | Pessimistischer Korridor | Keine Erholung |
| Hauptkatalysator | Geopolitik (Mittlerer Osten) | Externer Schock |
Mit Beginn des Jahres 2026 mehrten sich in der österreichischen Immobilienbranche Stimmen, die von einer Erholung oder gar einem neuen Immobilienzyklus sprachen. Gestützt wurde diese Sichtweise vor allem durch ein Transaktionsvolumen von rund 540 Mio. Euro im ersten Quartal 2026, ein Plus von etwa 37 % gegenüber dem Vorjahreszeitraum.
Doch dieser Optimismus täuscht. Kommerzielle Immobilientransaktionen benötigen typischerweise sechs bis neun Monate von der ersten Interessensbekundung bis zum Abschluss. Die Deals, die wir heute in den Statistiken sehen, spiegeln also eine Markterwartung von Mitte 2025 wider, nicht die aktuelle Stimmungslage.
Das erklärt auch, warum die Brutto-Renditen in einzelnen Asset-Klassen (Büro, Geschäftsfläche, Hotel, Logistik) trotz sich verschlechternder Gesamtlage derzeit noch scheinbar stabil auf hohem Niveau verharren.
Der D-DARKS CRE Sentiment Index basiert auf der systematischen NLP-Analyse deutschsprachiger Immobiliennachrichten der letzten 25 Jahre. Im April 2026 zeigt der Index ein deutliches Warnsignal:
Damit hat die Marktstimmung erstmals seit längerer Zeit in den negativen Bereich gedreht. Der Index unterstreicht, wie nachhaltig gedrückt die Erwartungshaltung am österreichischen Gewerbeimmobilienmarkt ist.
Die quantitative Themenanalyse zeigt eine sprunghafte Dominanz negativer Begriffe, während positive Stimmen regelrecht implodieren. Die fünf am häufigsten genannten Negativ-Begriffe im April 2026:
Besonders bemerkenswert: Begriffe wie „Panik" und „Rezession" werden nicht mehr nur von Einzelstimmen genannt, sondern finden quer durch das Marktteilnehmer-Spektrum Verwendung. Der Konflikt im Mittleren Osten wirkt dabei als Katalysator, der bereits bestehende Sorgen verstärkt.
Anders als während der Finanzkrise 2007/2008 präsentiert sich der österreichische Immobilienmarkt im Frühjahr 2026 (noch) nicht im Schockmodus. Das D-DARKS Stress-Niveau, ein kombinierter Indikator aus Sentiment und Volatilität, bewegt sich trotz der negativen Stimmung auf einem relativ niedrigen Niveau.
Was bedeutet das? Die Marktteilnehmer haben sich kollektiv auf die schlechten Nachrichten eingestellt. Es gibt kaum noch nennenswerte Gegenstimmen oder fundamentale Unsicherheit über die künftige Marktausrichtung. Die Branche driftet nicht mehr nur temporär in Richtung Pessimismus, die Marktstimmung hat sich strukturell in einem pessimistischen Korridor festgesetzt.
Sollte sich dieser Trend verfestigen, ist mit folgenden Entwicklungen zu rechnen:
Erwartungen prägen die Preisbildung – auch und gerade in der Immobilienwirtschaft. Wer früh erkennt, in welche Richtung sich das Marktnarrativ verschiebt, verschafft sich einen entscheidenden Lead-Time-Vorteil gegenüber rückblickenden Transaktionsdaten.
Der Markt befindet sich nicht in einer Erholung, sondern hat sich strukturell in einem pessimistischen Korridor festgesetzt. Der D-DARKS CRE Sentiment Index steht im April 2026 bei –14,6 Punkten.
Transaktionen aus Q1 2026 reflektieren Markterwartungen von vor ca. 6–9 Monaten. Das aktuelle Sentiment wird sich daher erst zeitverzögert in den Transaktionsvolumen niederschlagen.
Derzeit noch nicht absehbar. Im Gegensatz zur Finanzkrise 2007/2008 ist das Stress-Niveau niedrig. Es herrscht noch keine Panik, sondern eine konsolidierte Resignation der Marktteilnehmer.
Die Brutto-Renditen für Büro, Geschäftsfläche, Hotel und Logistik verharren derzeit noch auf hohem Niveau – eine Anpassung in den kommenden Quartalen ist jedoch wahrscheinlich.
Der österreichische Gewerbeimmobilienmarkt sendet im April 2026 ein klares Warnsignal. Wer ausschließlich auf rückblickende Transaktionsdaten setzt, läuft Gefahr, die strukturelle Veränderung der Markterwartungen zu übersehen. Qualitative Marktintelligenz wird damit zum entscheidenden Frühwarninstrument für institutionelle Investoren.
CRE market sentiment Austria is the first product roll out of D-DARKS GmbH aimed to help investors, lenders and commercial real estate professionals make better risk and investment decisions.
Market sentiment is not a soft concept. In commercial real estate, it is the earliest hard signal available: the collective reading of where conditions stand before any of that reading shows up in transaction data, vacancy statistics or yield movements. For institutional investors, lenders and advisors operating in the commercial real estate market, understanding how to measure that signal, and what to do with it, has become a more pressing question than it has been for some time.
Markets Are Driven by Numbers and Narrative
Commercial real estate runs on two parallel tracks simultaneously. The first is numerical: yields, vacancy rates, transaction volumes, financing spreads and it is well served by the industry's existing measurement infrastructure. Market reports, research publications and data providers have built sophisticated frameworks for capturing and distributing this information, and institutional decision-making is appropriately anchored in it.
The second track is narrative, and it has never been properly measured. Not because it is less important, in many respects it is the more consequential of the two, but because until recently there was no reliable way to read it systematically. Narrative travels through professional networks, through conversations at industry gatherings, through the editorial positions of specialist publications and the carefully worded statements of market participants. It is always the same circles, always the same voices, always filtered through the professional and commercial interests of whoever is willing to be quoted or to respond to a survey.
What makes this worth taking seriously is not that narrative is separate from the numbers. It is that narrative moves first. Market expectations shift in the language of the market before they appear in transaction data. The mood of a specific asset class or geography, the collective sense among practitioners that conditions are tightening, or that cautious optimism is beginning to replace anxiety, establishes the direction of capital movement before that movement is visible in any measurement that the industry currently produces at scale.
The Market Communicates Continuously and Simultaneously Across Many Channels
This is where the nature of the signal matters. Market sentiment is not expressed through a single channel. It emerges from the full spectrum of professional market communication: specialist trade publications, corporate press releases from listed companies, market reports from research houses, event commentary, expert analysis, earnings calls, insolvency filings, planning announcements and deal coverage. Each of these sources carries both narrative and, embedded within it, the market's own framing of quantitative reality.
When a listed real estate company describes its refinancing position in a press release, it is not just providing a number. It is expressing a level of confidence, concern or strategic orientation that a number alone cannot capture. When a research house publishes a market report on the Austrian office market, the language in which it frames vacancy trends tells as much as the vacancy figure itself. When trade publications begin covering a particular topic such as insolvency risk, ESG pressure or interest rate sensitivity, with increasing frequency and intensity, that shift in editorial focus is itself a signal.
The D-DARKS CRE Market Sentiment Index reads this full corpus of market communication systematically, extracting and quantifying the signal embedded across all of these source types simultaneously. The market was always producing this language. What has changed is the ability to read it at scale, continuously and without the structural limitations of traditional measurement approaches.
The Gap Between What the Market Is Saying and What the Data Will Eventually Show
Every experienced commercial real estate professional in commercial real estate has encountered the same phenomenon. You arrive at a major industry gathering such as Expo Real, MIPIM, a significant regional conference and within the first day of conversations you have a clear sense of where the market stands. Whether the dominant tone is cautious optimism, silent anxiety, or something more difficult to characterise, the aggregate of professional conversations produces a reading that experienced practitioners trust, because they have seen it precede market movements often enough to take it seriously.
The problem is not that this reading is unreliable. The problem is that it is not scalable, not quantifiable, and not comparable across time periods or geographies. It reflects whoever you spoke to, filtered through your own network and your own analytical framework, and it disappears the moment the conference ends.
Data-driven CRE market sentiment analysis does not replace that practitioner instinct. It extends it by reading the equivalent of thousands of professional conversations across every major source of specialist market communication in Austria, across every asset class, and producing a single quantified reading that can be tracked over time, broken down by geography and asset class, and interrogated for the specific topics and concerns that are driving the mood at any given moment.
Two Layers of Intelligence
Measuring the signal, however, is only the first part of what is useful. Market sentiment does not exist independently of market conditions. The sentiment the D-DARKS index captures is shaped, in part, by the empirical realities of the Austrian CRE market: by financing conditions, by transaction activity, by the performance of specific asset classes, all of which enter the market communication we measure and are therefore already embedded in the signal.
What that signal means in the context of current market conditions, and what the implications are for specific investment decisions, asset classes or geographies, requires a second layer: expert interpretation by practitioners who have spent decades working with these markets. The index tells you where collective market conviction currently stands. The report contextualises it, drawing on the kind of market experience that gives a quantified signal its practical meaning.
This combination: AI-powered measurement of the full market narrative, interpreted by commercial real estate practitioners is the foundation of the D-DARKS approach to CRE market intelligence.
What This Series Covers
This is the first in a series of posts examining how data-driven sentiment analysis works, what it measures, and why the methodology represents a meaningful advance over traditional approaches. The following posts will examine the structural limitations of telephone-based survey indices, the four dimensions of sentiment that a single positive/negative score cannot capture, the importance of granularity by asset class and geography, and the role of topic analysis and sentiment volatility as forward-looking signals.
D-DARKS measures the narrative of the commercial real estate market continuously, drawing from the full spectrum of professional market communication and interpreted by practitioners with decades of market experience.
D-DARKS Gewerbeimmobilien Stimmungsindex Österreich wurde entwickelt, um Investoren, Kreditgebern und Immobilienprofis dabei zu helfen, fundiertere Risiko- und Investitionsentscheidungen zu treffen.
Marktstimmung ist kein weicher Begriff. Im gewerblichen Immobilienmarkt (CRE) ist sie das früheste verfügbare harte Signal: die kollektive Einschätzung der aktuellen Marktlage, noch bevor sich diese in Transaktionsdaten, Leerstandsstatistiken oder Renditeentwicklungen niederschlägt. Für institutionelle Akteure am österreichischen Markt ist die Messung dieses Signals zu einer der drängendsten Fragen der aktuellen Zeit geworden.
Märkte werden von Zahlen und Narrativen getrieben
Der Gewerbeimmobilienmarkt bewegt sich simultan auf zwei Gleisen:
Das Entscheidende ist: Das Narrativ steht nie isoliert neben den Zahlen. Aber es ist das Narrativ, das sich zuerst bewegt. Markterwartungen äußern sich in der Sprache des Marktes, lange bevor diese in harten Zahlen sichtbar werden. Die kollektive Wahrnehmung einer Assetklasse oder einer Region gibt die Richtung der Kapitalflüsse vor, noch bevor die erste Transaktion verbucht ist.
Bisherige Ansätze (wie Telefonumfragen) scheitern oft an geringen Teilnehmerzahlen oder der Voreingenommenheit der Befragten. Bis jetzt! Denn D-DARKS schließt diese Lücke durch eine systematische, objektive Erfassung, ohne die Einschränkungen klassischer Stichproben.
Der Markt kommuniziert kontinuierlich über viele Kanäle
Marktstimmung entsteht aus dem gesamten Spektrum professioneller Kommunikation, wie etwa Fachpublikationen, Pressemitteilungen, Marktberichte, Event Kommentare, Expertenanalysen, Earnings Calls, Insolvenzanmeldungen, Berichte über Immobilienentwicklungen oder Transaktionsmeldungen. Jede dieser Quellen trägt sowohl ein Narrativ, als auch, darin eingebettet, die markteigene Interpretation der quantitativen Realität.
Wenn ein Immobilienunternehmen in einer Pressemitteilung dessen Refinanzierung beschreibt, liefert es mehr als eine Zahl. Es vermittelt ein Maß an Zuversicht oder Besorgnis, das eine Ziffer allein nicht erfassen kann. Wenn Fachmedien Themen wie Insolvenzrisiken, ESG-Druck oder Zinssensitivität mit zunehmender Intensität aufgreifen, ist schon diese Verschiebung des Fokus selbst ein Signal.
Der D-DARKS CRE Marktstimmungs Index extrahiert und quantifiziert diese Signale skalierbar und kontinuierlich über alle Quellentypen hinweg. Der Markt hat schon immer kommuniziert. Neu ist die Fähigkeit, diese Kommunikation und die darin enthaltenen Signale systematisch lesbar zu machen, ohne die strukturellen Einschränkungen traditioneller Methoden hinnehmen zu müssen.
Die Lücke zwischen Marktecho und Datenevidenz
Jeder Immobilienprofi kennt das “Messe - Phänomen”. Nach einem Tag auf der Expo Real oder der MIPIM hat man ein klares Gespür für den Markt. Das Problem: Dieses Gefühl ist subjektiv, nicht skalierbar und verflüchtigt sich schnell.
Unsere datengestützte Analyse ersetzt diesen Instinkt nicht. Sie erweitert ihn. Wir analysieren das Äquivalent von tausenden professionellen Gesprächen quer durch alle Assetklassen in Österreich. Das Ergebnis ist ein objektiver, quantifizierter Wert, der präzise aufzeigt, welche Themen die Marktstimmung aktuell antreiben.
Zwei Ebenen der Marktintelligenz
Diese Kombination bildet das Fundament der D-DARKS Methode: modernste Technologie trifft auf tiefgreifende Praxiserfahrung.
Ausblick: Was diese Serie bietet
Dies ist der Auftakt einer Serie, in der wir die Methodik hinter der datengestützten Analyse beleuchten. In den nächsten Beiträgen untersuchen wir:
D-DARKS misst kontinuierlich das Narrativ des Gewerbeimmobilien Marktes mit Hilfe des gesamten Spektrums der Marktkommunikation und interpretiert die Ergebnisse auf Basis jahrzehntelanger Markterfahrung.